AcaGenie – User guide
AcaGenie takes you from a research question to a manuscript with references you can trust: find quality papers, identify the mainstream of a topic, write with citations that can be verified, and check the references of your manuscript.
1. Getting started
Search hundreds of millions of publications, filter by journal ranking, year and your institution's publications.
Collect the most-cited recent papers in a folder in one click and let AI map the research streams.
AI writes only from the papers you chose; every citation comes with the original passage, checked automatically.
Upload a manuscript to find retracted works, compare each citing sentence with the cited paper and normalise the reference list (APA, Harvard, Vancouver).
Duplicate removal, two independent screeners with exclusion reasons, and an automatic PRISMA 2020 diagram.
Keyword, co-authorship and co-citation networks; h-index, Bradford, Lotka, thematic maps, international collaboration – with a Word report.
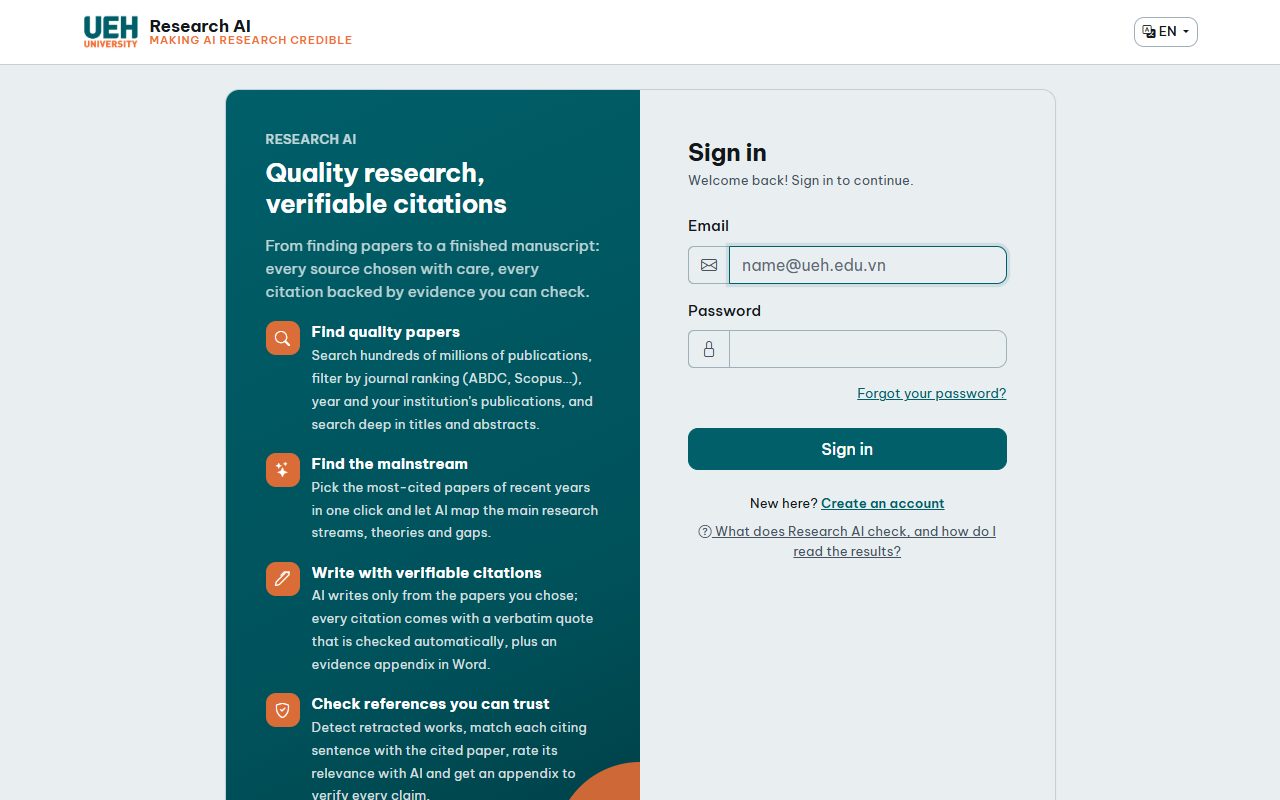
- Create an account with Create an account: your e-mail and a password of at least 8 characters, plus the security code shown in the picture.
- Confirm your e-mail: open the link in the e-mail you receive (valid 48 hours). No e-mail? Check the spam folder or ask for a new link on the sign-in page.
- Sign in. You start on Search articles. The top bar holds the main pages – Search articles, History, My summaries, Folders, Systematic review, Science map, Reference Checks, Journal finder – the language switch (EN / VI), your credit counter and the account menu (change password, credits, sign out).
2. Search articles
Open Search articles, type your keywords and press Search.
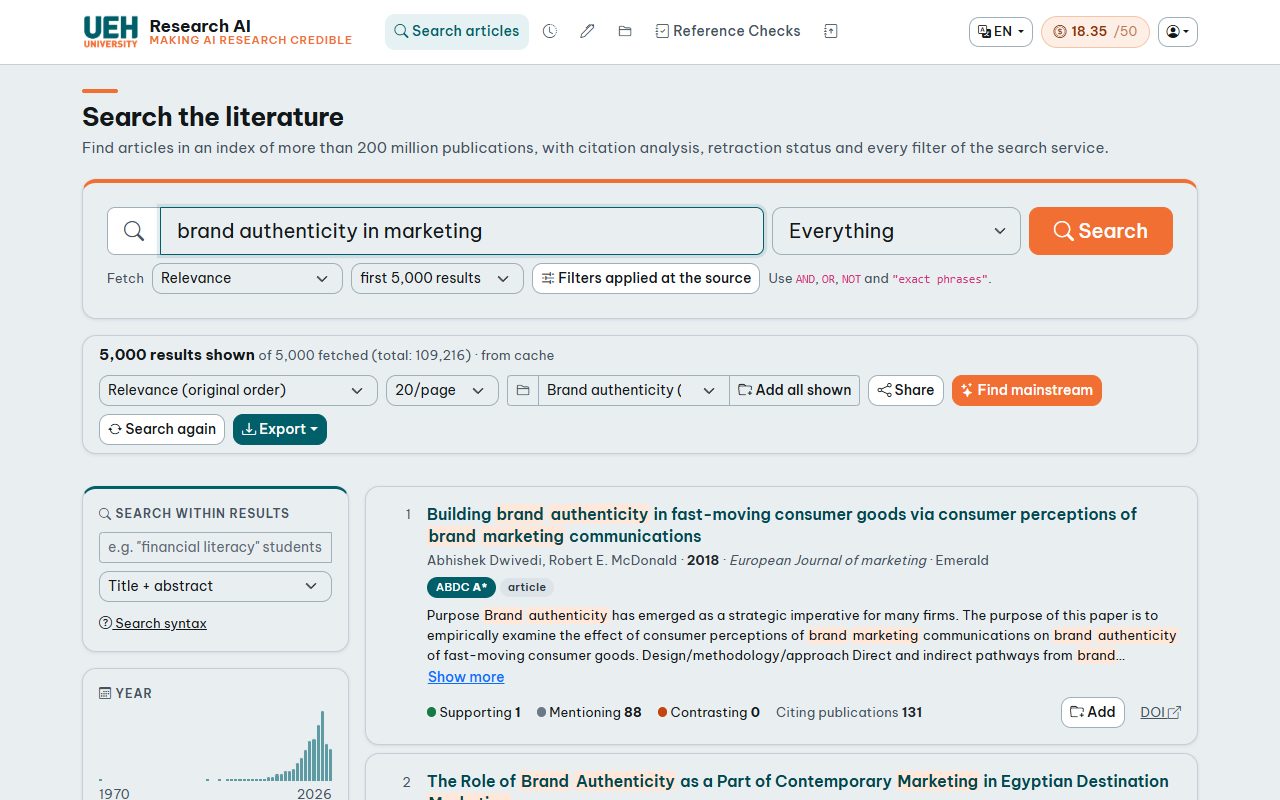
- Search mode: Fast search (default, almost free) returns results with citing publications, journal rankings, open access and retraction status; supporting / contrasting counts are fetched per page with Supporting/contrasting for this page (uses credits). Citation deep search has supporting / contrasting counts for all results, plus filters on citation statements, editorial notices, substances and MeSH – uses more credits.
- Query syntax:
AND,OR,NOTand"exact phrases", e.g."digital transformation" AND SMEs NOT banking. - Where to search: everything, or only title, abstract … (the list next to the search box).
- Fetch – the order in which results are collected (relevance, most cited, newest …) and how many (the first 200 up to several thousand). More results take longer but give the filters more to work with.
- Filters applied at the source – year range, journal, publication type and other conditions applied before the results are fetched.
Each result shows authors, year, journal, the journal's ranking badges (e.g. ABDC A*, FT50), your institution's publication badge, open access, retraction status and the citation figures: supporting, mentioning, contrasting and the number of citing publications (see section 18).
3. Filter and sort results
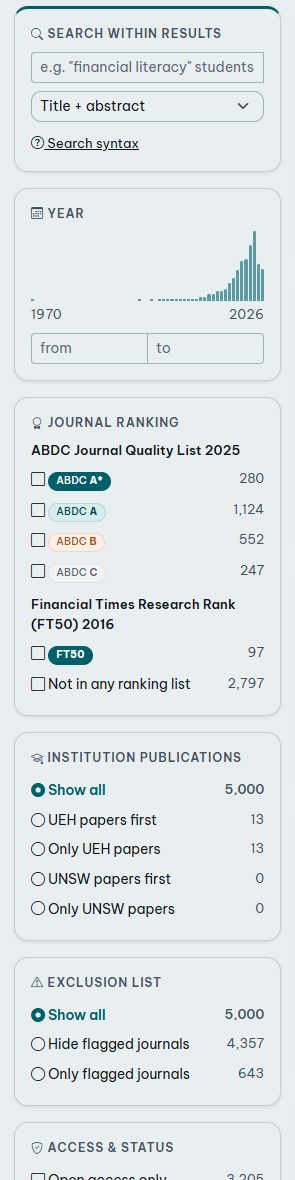
All filters work instantly on the fetched results, without a new search:
- Year – the bar chart shows how many papers appeared per year; set a from–to range.
- Journal ranking – keep only journals with a given rating in the ranking lists of the system (ABDC, FT50 …), or show unranked ones.
- Journal, publication type, open access.
- Exclusion list – papers in journals or from publishers flagged by the administrator (e.g. Beall's List, a journal group) are marked in red; hide them or show only them.
- Institution publications – put your institution's papers first or show only them.
- Minimum supporting / contrasting citations or citing publications, and hide or show retracted papers.
Every active filter appears as a chip above the results; click a chip to remove it. Sort by relevance, best match, year, journal rank or any citation figure, and choose 10–100 results per page.
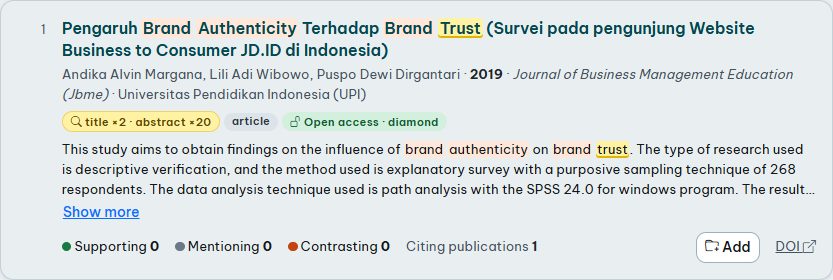
Export saves the results currently shown (after your filters) as Excel, CSV, RIS, BibTeX or JSON.
4. Search within results
The box Search within results searches deep in the titles and abstracts of the fetched results – useful to narrow a broad search to your exact angle.
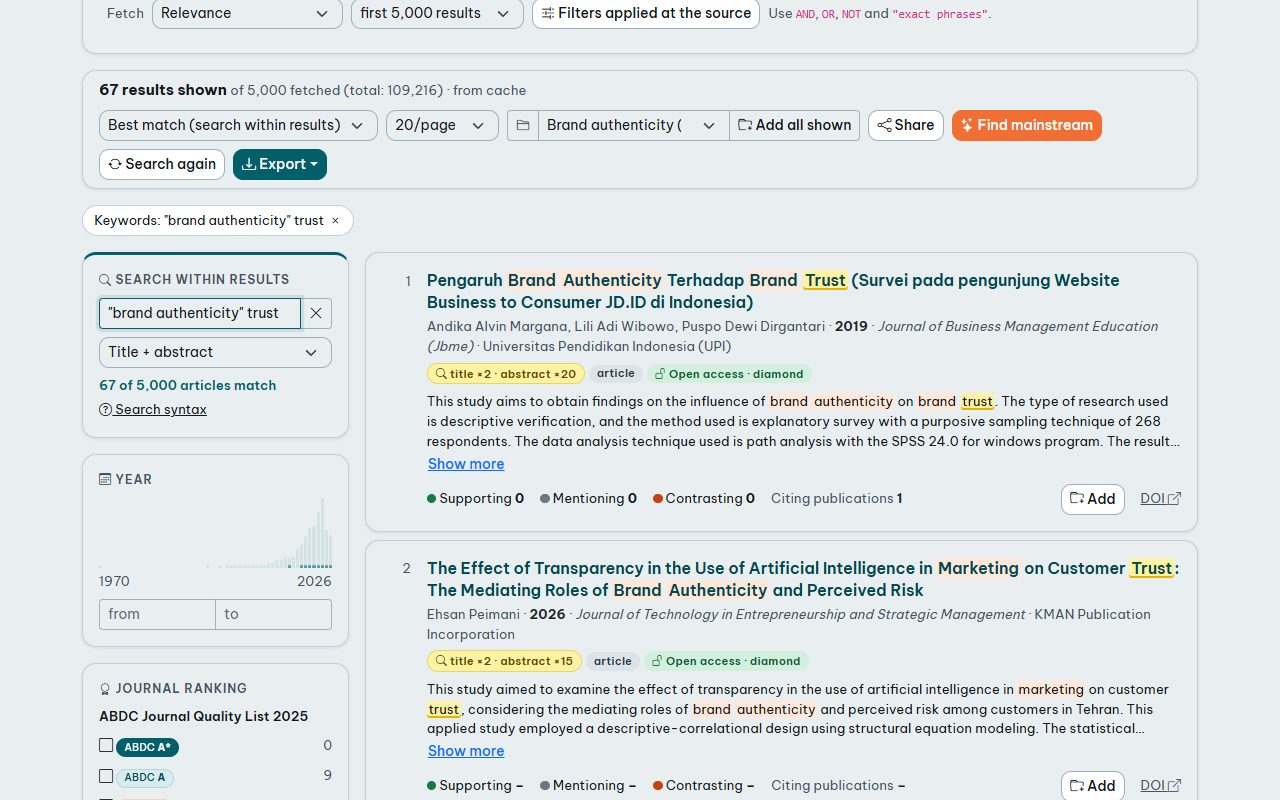
- Several words: all must appear.
"exact phrase",ORbetween alternatives,-wordto exclude,finan*for word beginnings. - Accents and capitals are ignored; choose whether to search title + abstract or the title only.
- Sort by Best match to bring the most relevant papers to the top.
5. Find the mainstream
The most-cited papers of a topic usually form its mainstream. After filtering, press Find mainstream:
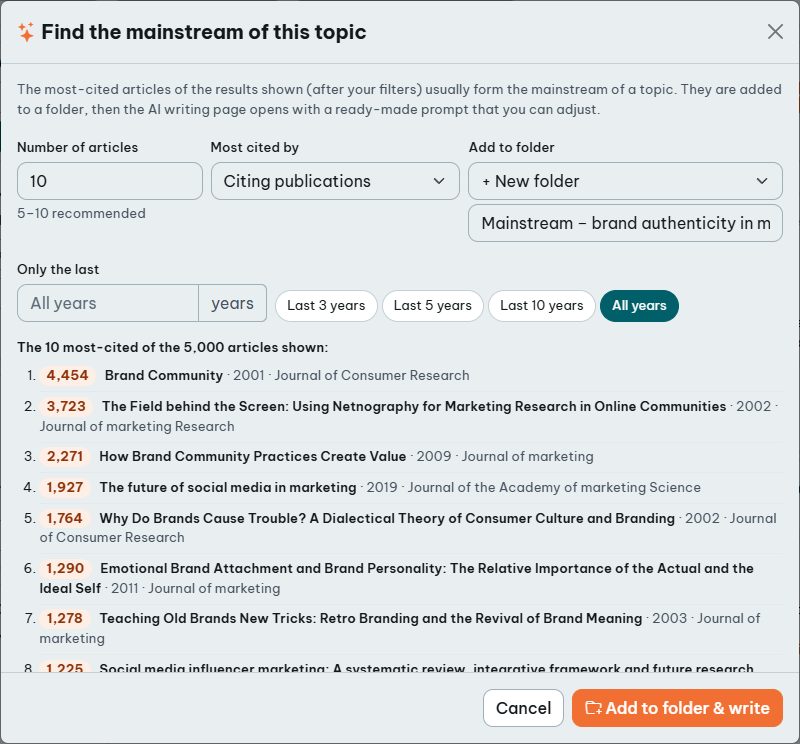
- Choose the number of papers (5–10 is typical), the recent years to consider and how to rank them (citing publications, all citations or supporting citations).
- Choose a folder or create a new one, and confirm.
- The writing page opens with these papers selected and a ready-made prompt that asks the AI for the main streams, theories, agreed findings, debates and gaps. Adjust the prompt if you like and press Write (section 8).
6. Folders
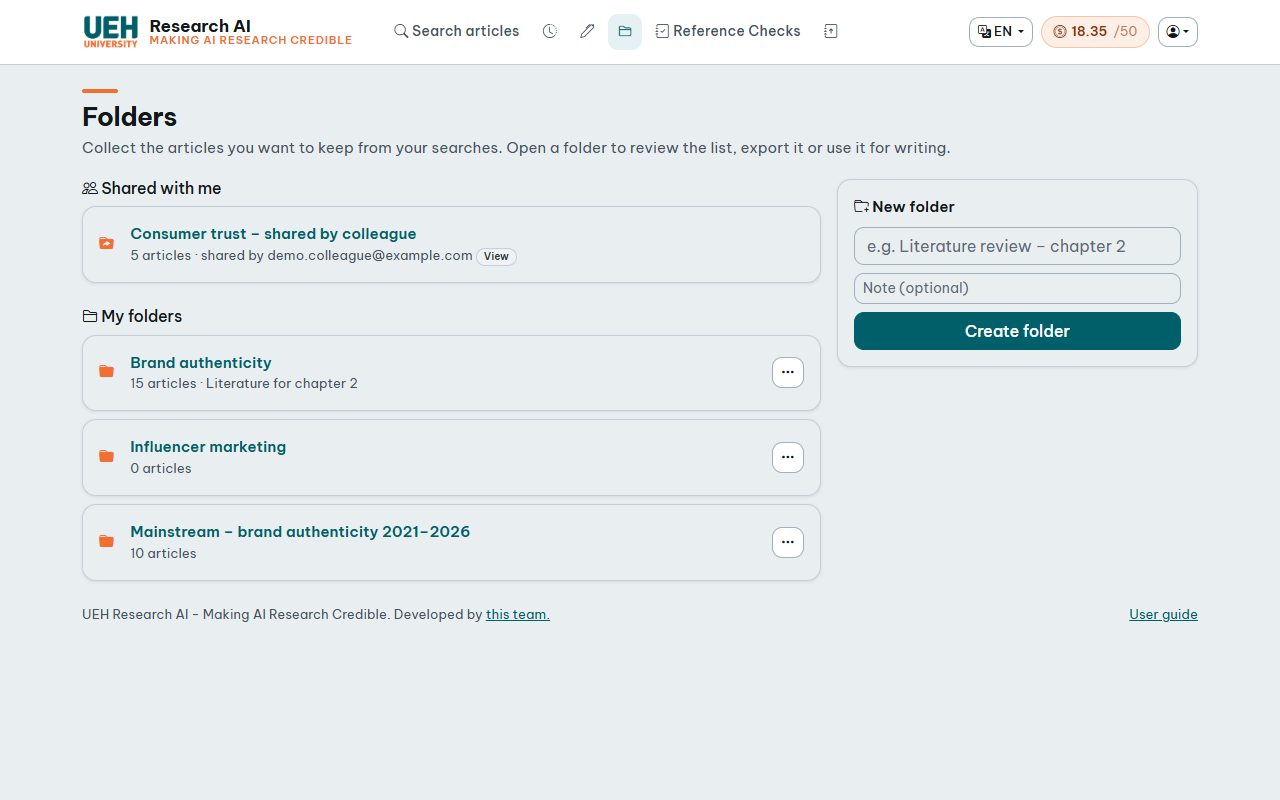
Folders collect the papers you want to keep. In the results toolbar choose a folder (or create one), then press Add on a paper – or Add all shown for every paper that passes your filters. A folder keeps a full copy of each paper, so it stays available even when the search results expire.
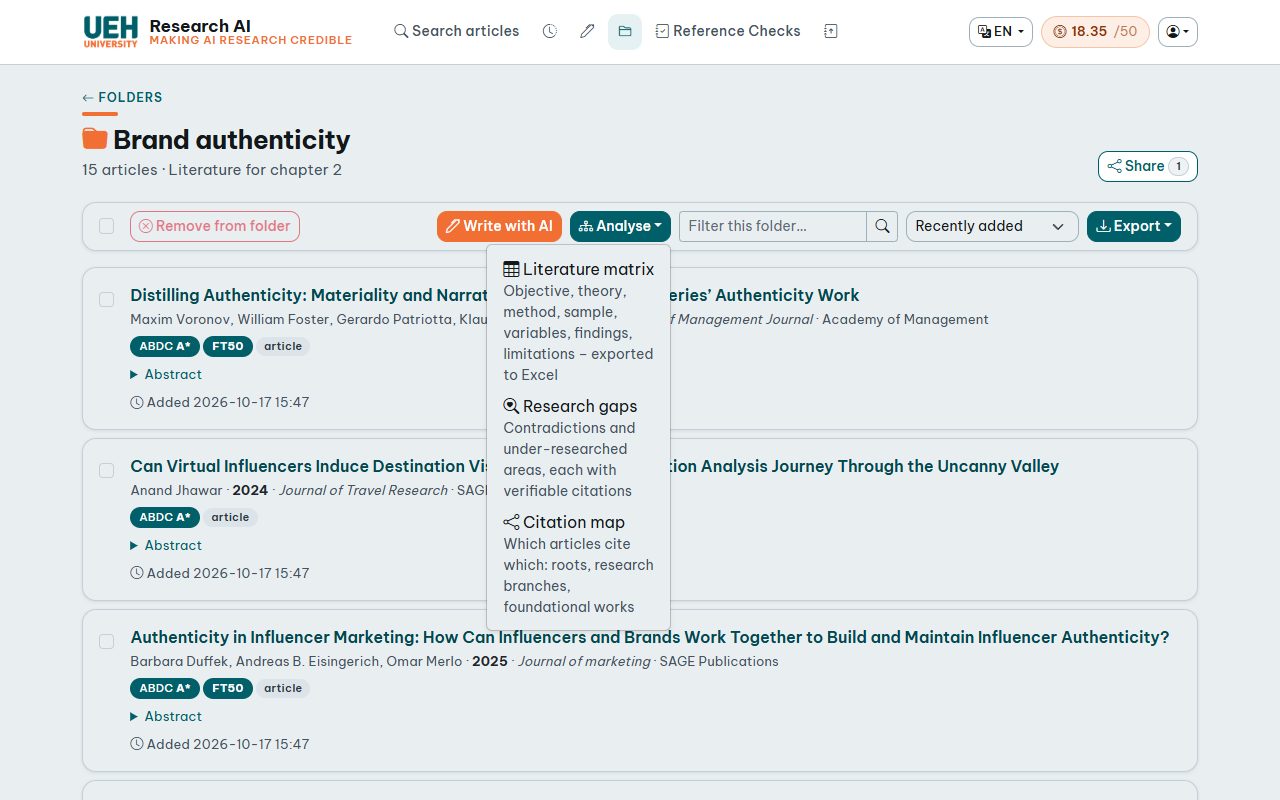
- Summarise & quick read from the papers of the folder (section 8).
- Analyse: literature matrix, research gaps, citation map, science map and systematic review (PRISMA).
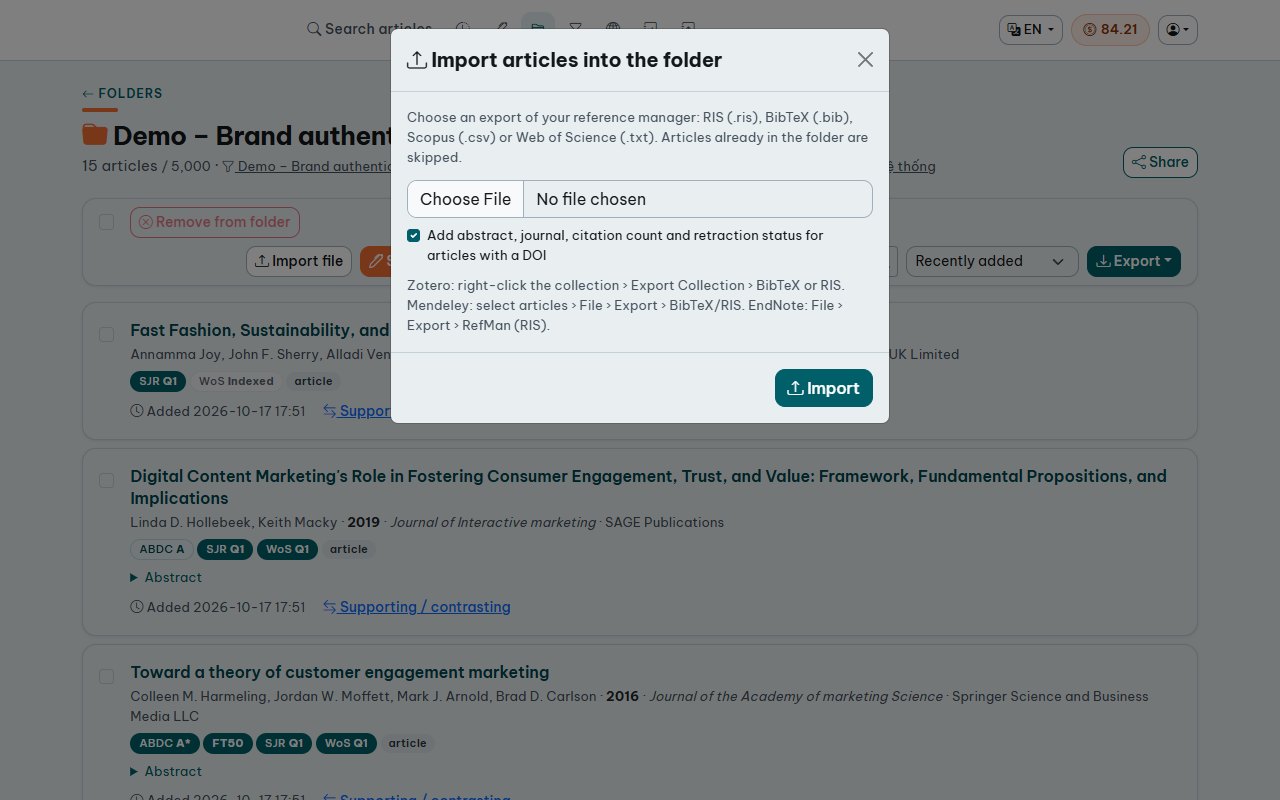
- Import file : bring exports from Zotero, Mendeley, EndNote (RIS
.ris, BibTeX.bib), Scopus (CSV) or Web of Science (.txt) straight into the folder. Tick Add abstract, journal, citation count and retraction status to complete the records by DOI. Papers already in the folder are not added twice. - Export as Excel, CSV, JSON, RIS or BibTeX – RIS and BibTeX files import directly into Zotero, EndNote and Mendeley.
- Tick papers to remove them; rename or delete a folder from the menu on the Folders page.
- Limits: a folder holds up to 5,000 papers. The AI features (summaries, matrix, research gaps, citation map) work on folders of up to 200 papers; the science map and systematic reviews work on large folders too.
- Supporting / contrasting under each paper shows which later works support or contrast it (classified by the citation index, with the section where they cite it); tick works and add them to a folder. Analyse › Papers to add collects the citation index's recommendations for the folder's most-cited papers, and Free full text links lead to open-access copies of the papers.
7. Sharing
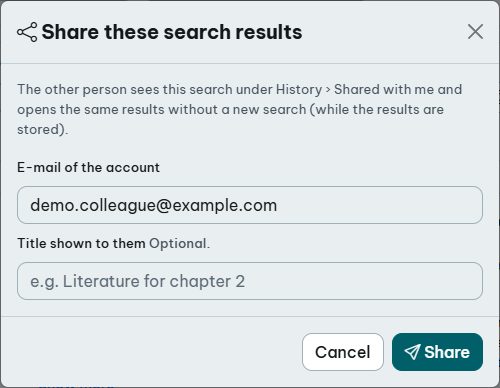
Share a folder or a set of search results with another account by its e-mail address (the person must have an account).
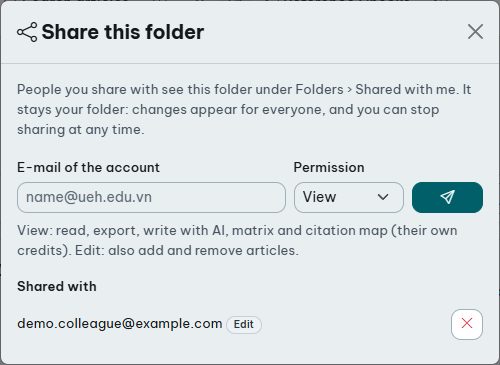
- Folder – press Share on the folder page, enter the e-mail and choose View (read, export, summarise & quick read, matrix and citation map) or Edit (also add and remove papers). The list in the same window shows who has access; stops sharing.
- Search results – press Share in the results toolbar. The other person opens exactly these results without a new search while they are stored.
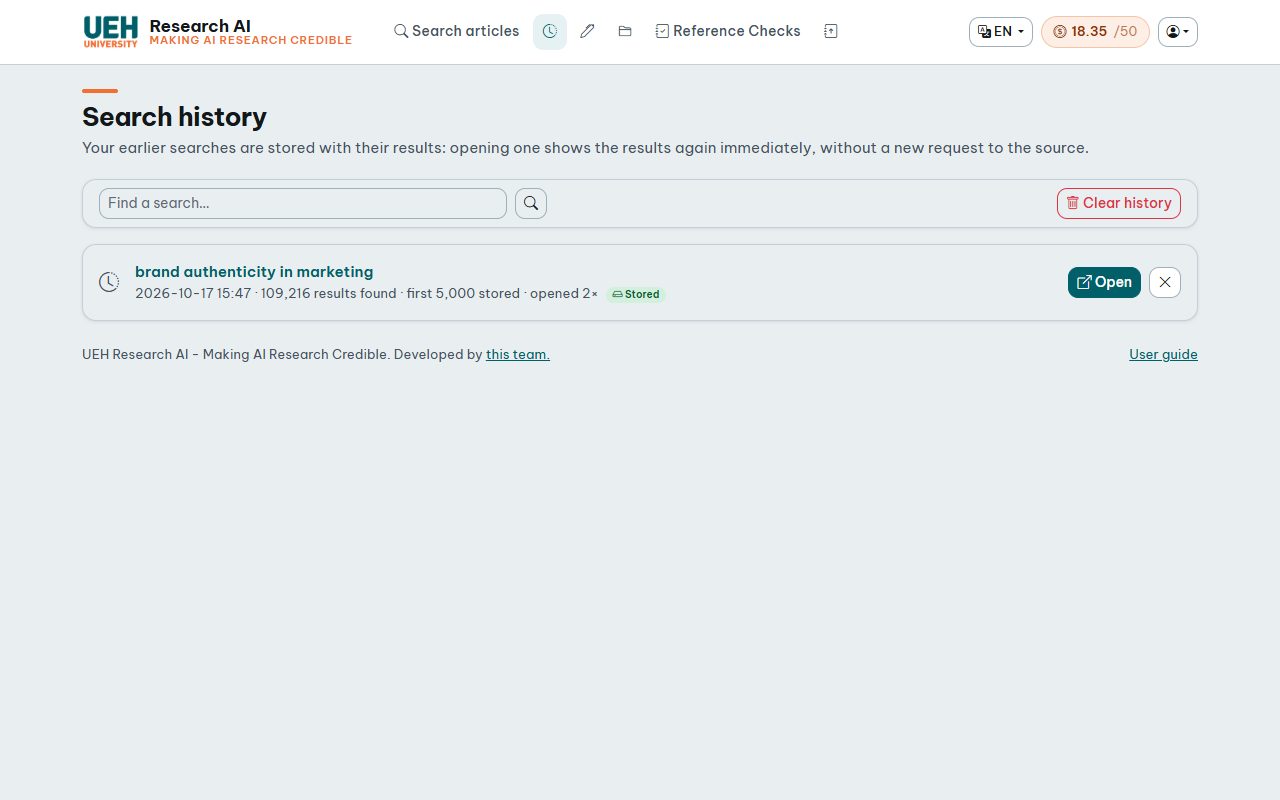
- Recipients find shared items under Shared with me on the Folders and History pages, and receive an e-mail when e-mail is enabled.
- A shared folder stays its owner's folder: changes appear for everyone. Recipients can Save a copy to get their own folder, or remove it from their list.
8. Summarise & quick read
From a folder, press Summarise & quick read. The AI writes only from the papers you select (their title and abstract) and never adds sources of its own.
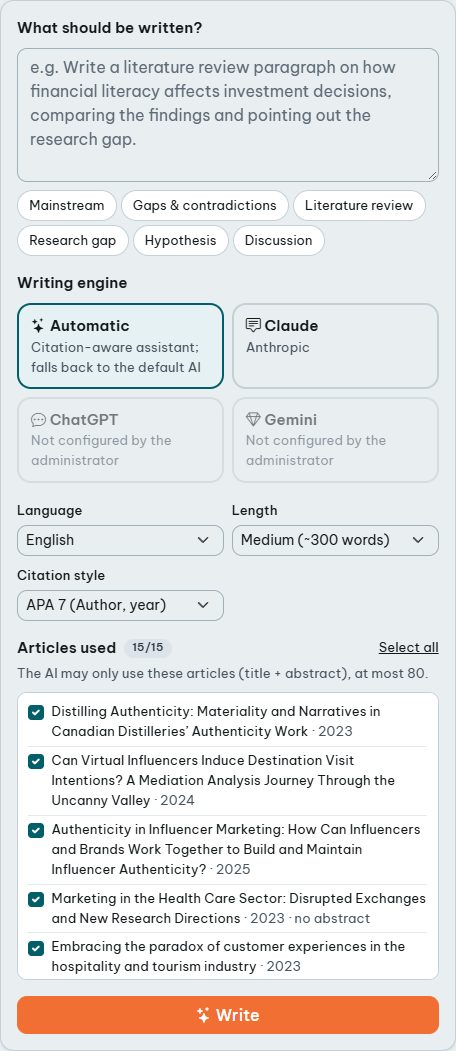
- Describe what you want or click a template (mainstream, research gaps, literature review, hypothesis, discussion …).
- Choose the engine: Automatic (citation assistant, otherwise the default AI), Claude, ChatGPT or Gemini – the ones the administrator has enabled.
- Language (Vietnamese or English), length and citation style:
Style In the text Reference list APA 7 (Napoli et al., 2014) Napoli, J., … (2014). Title. Journal, 24(2), 200–218. Harvard (Napoli, Dickinson-Delaporte and Beverland, 2014) Napoli, J. … (2014) ‘Title’, Journal, 24(2), pp. 200–218. Chicago author-date (Napoli, Dickinson-Delaporte, and Beverland 2014) Napoli, Julie, … 2014. “Title.” Journal 24 (2): 200–218. IEEE [1] [1] J. Napoli et al., “Title,” Journal, vol. 24, no. 2, pp. 200–218, 2014. Vancouver [1] [1] Napoli J, Dickinson-Delaporte S, Beverland MB. Title. Journal. 2014;24(2):200-218. - Tick the papers to use (up to 80; papers without an abstract only contribute their title) and press Write. The button shows the progress; a text usually takes 20–60 seconds.
- Debates (chip, or Analyse › Debates in a folder): the AI also receives which papers of the folder support or contrast each other according to the citation index, and may describe such a relation only when it is listed. Add contrasting works to the folder first to get a real debate.
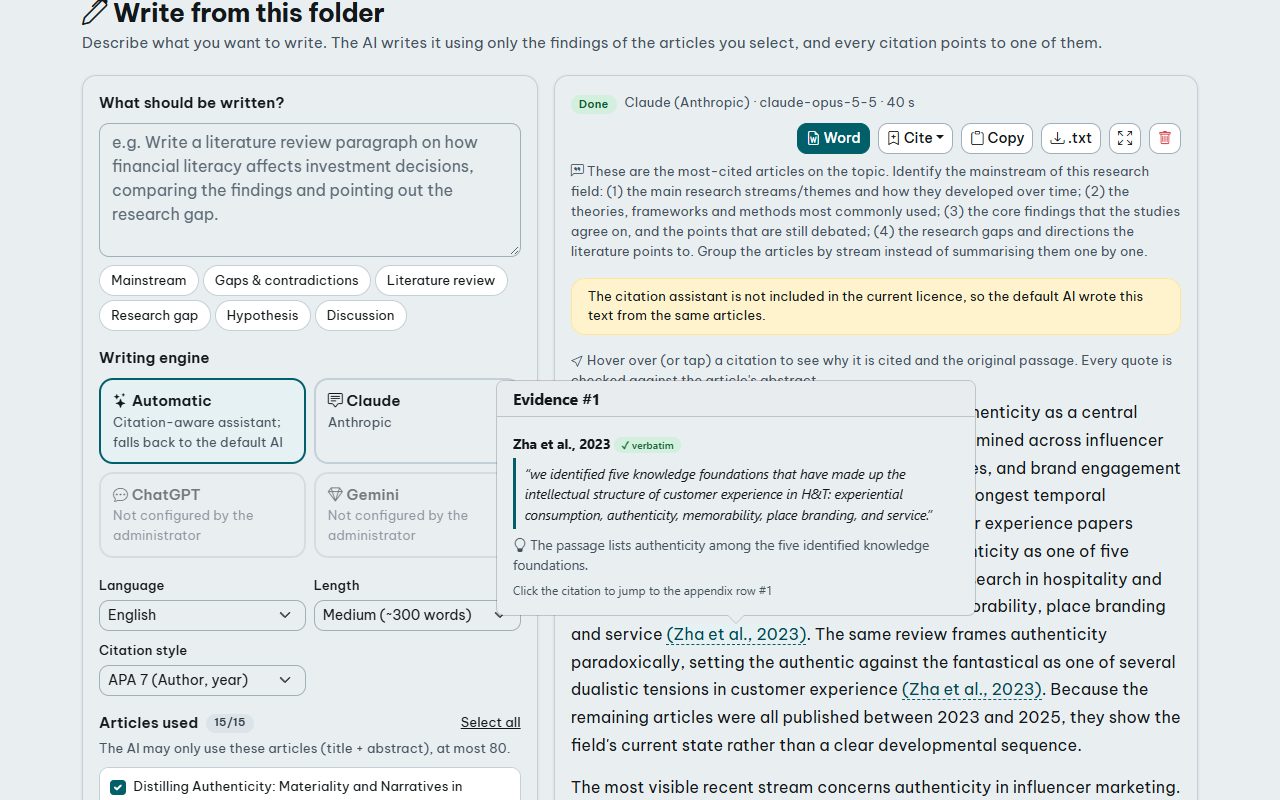
Every citation is backed by a passage that the AI copied from the abstract, and the system checks that the passage really is there:
| ✓ verbatim | The quote appears word for word in the abstract. |
|---|---|
| ≈ nearly verbatim | Almost all words match (small differences such as spelling). |
| ✗ not found | The quote is not in the abstract – the AI may have paraphrased or invented it. Verify before use. |
| ! no quote | No passage was given for this source. |
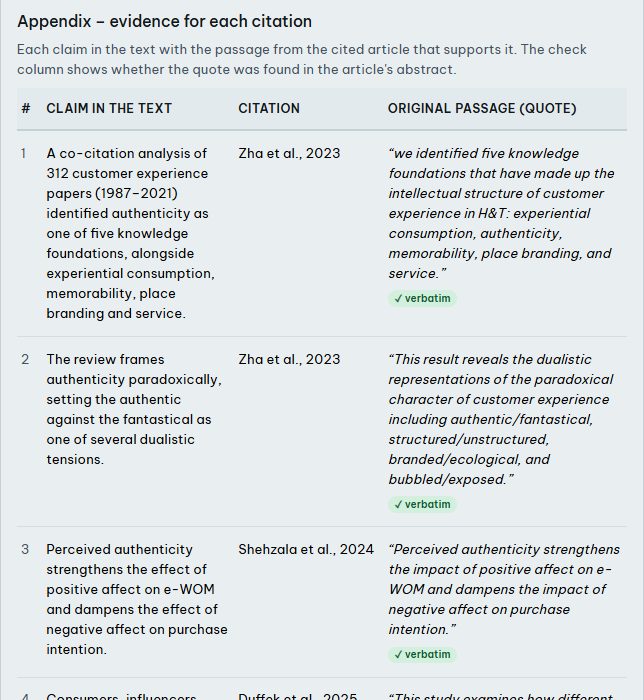
- Hover over (or tap) a citation to see the reason and the passage; click it to jump to its row in the appendix, which lists every claim with its quote and reason.
- The reference list is built from the folder's own data, so no reference is invented.
- Read in full screen (Esc to leave), copy the text, download it as Word (text, references and appendix) or as .txt, and use Cite to download the references as RIS or BibTeX.
- Every text is saved in My writings; opening one shows it instantly without a new AI request. Texts are kept even if you delete their folder.
9. Research gaps
In a folder choose Analyse › Research gaps. The writing page opens with a template that asks the AI for:
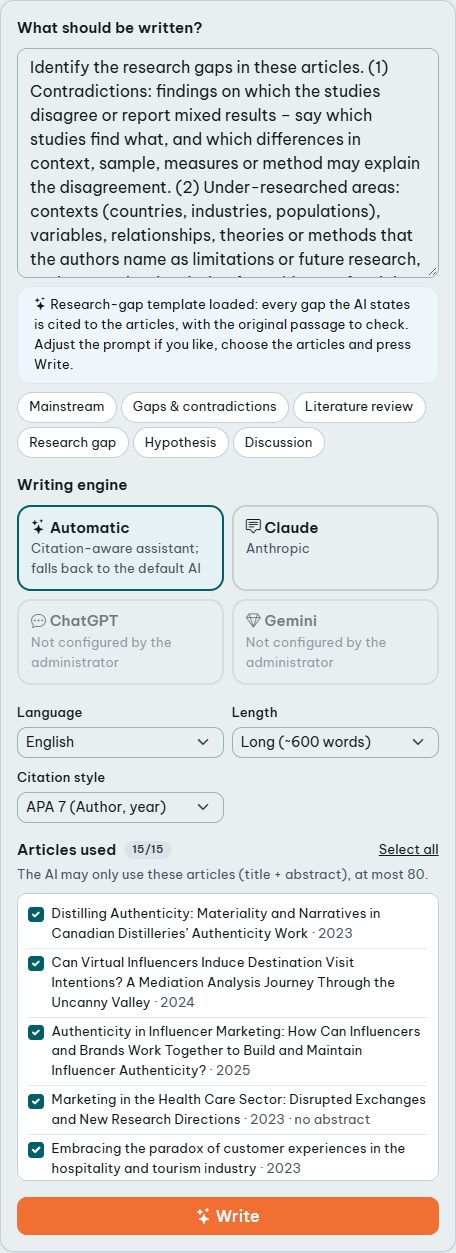
- Contradictions – findings on which the studies disagree, and the differences in context, sample, measures or method that may explain them;
- Under-researched areas – contexts, variables, relationships, theories or methods named as limitations or clearly missing from the set;
- A concrete research question for each gap.
Every gap is cited with the original passage, exactly like any AI text, and the AI says when a gap is inferred from what is absent rather than stated by the authors.
10. Literature matrix
In a folder choose Analyse › Literature matrix: AI reads the abstract of every selected paper and fills one comparison table – the backbone of a literature review chapter.
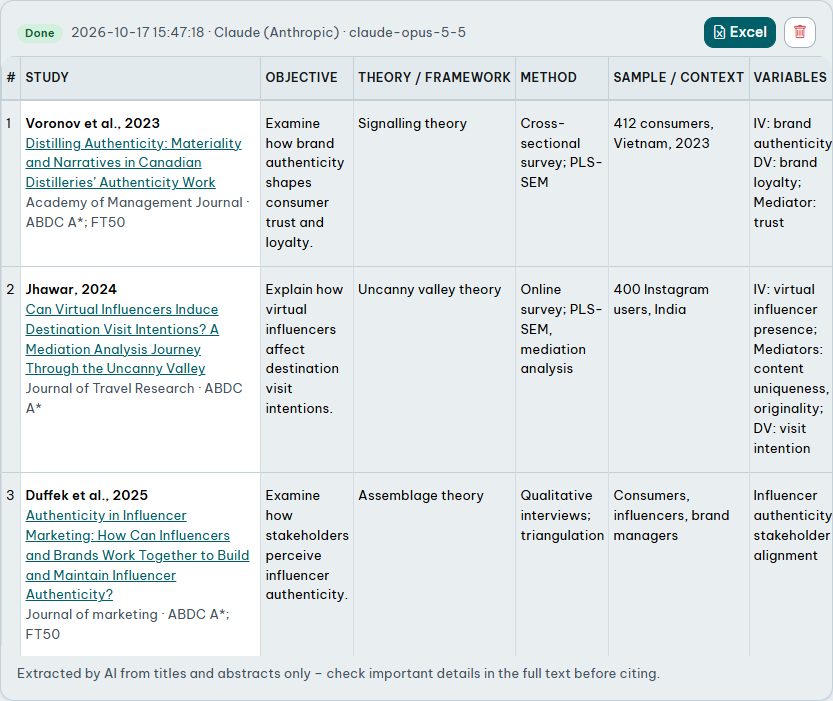
- Columns: objective, theory / framework, method, sample / context, variables (IV, DV, mediators, moderators), main findings, limitations / future research, plus a verbatim supporting passage whose presence in the abstract is checked.
- What the abstract does not say is marked “Not reported in the abstract” – nothing is guessed.
- Choose the AI model and the language, tick the papers (up to 150) and press Build the matrix. The AI reads about 8 papers per step and the table fills as it goes.
- Excel downloads the table (with the APA reference of each paper) for sorting and extending. Earlier matrices of the folder are listed on the left.
11. Citation map
In a folder choose Analyse › Citation map to see which papers of the folder cite which. Reference lists are matched by DOI.
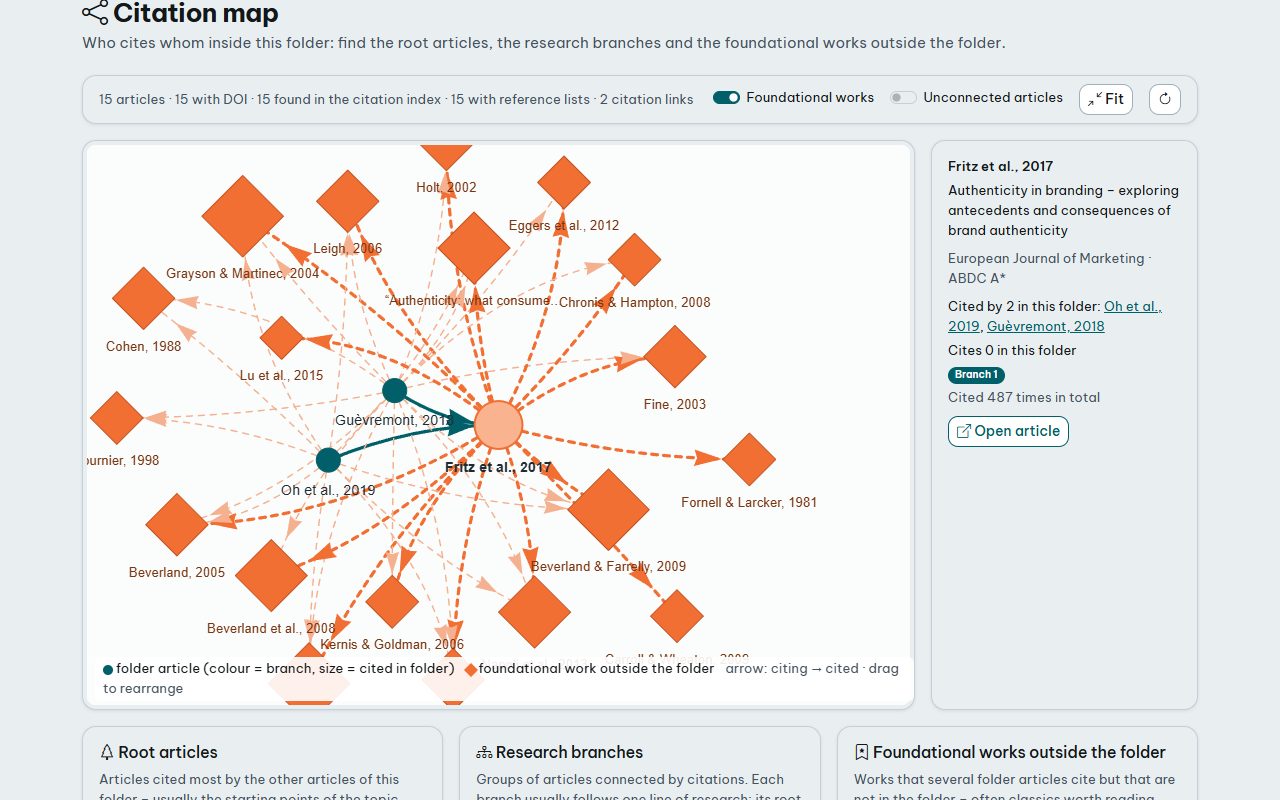
- Circles are folder papers (colour = research branch, size = how often they are cited inside the folder); diamonds are works outside the folder that several folder papers cite. Arrows point from the citing to the cited paper.
- Click a paper to see who it cites and who cites it; drag to rearrange, scroll to zoom, Fit to see everything.
- Below the map: root articles (cited most inside the folder – usually the starting points), research branches (groups of papers connected by citations) and foundational works outside the folder – often classics worth reading and adding.
- Papers without a DOI, or whose publisher does not share reference lists, cannot be connected. The map is saved: opening it again makes no new query. Only Refresh reads the data sources again (uses credits); when the folder has changed, the saved map is shown with a notice.
12. Science map
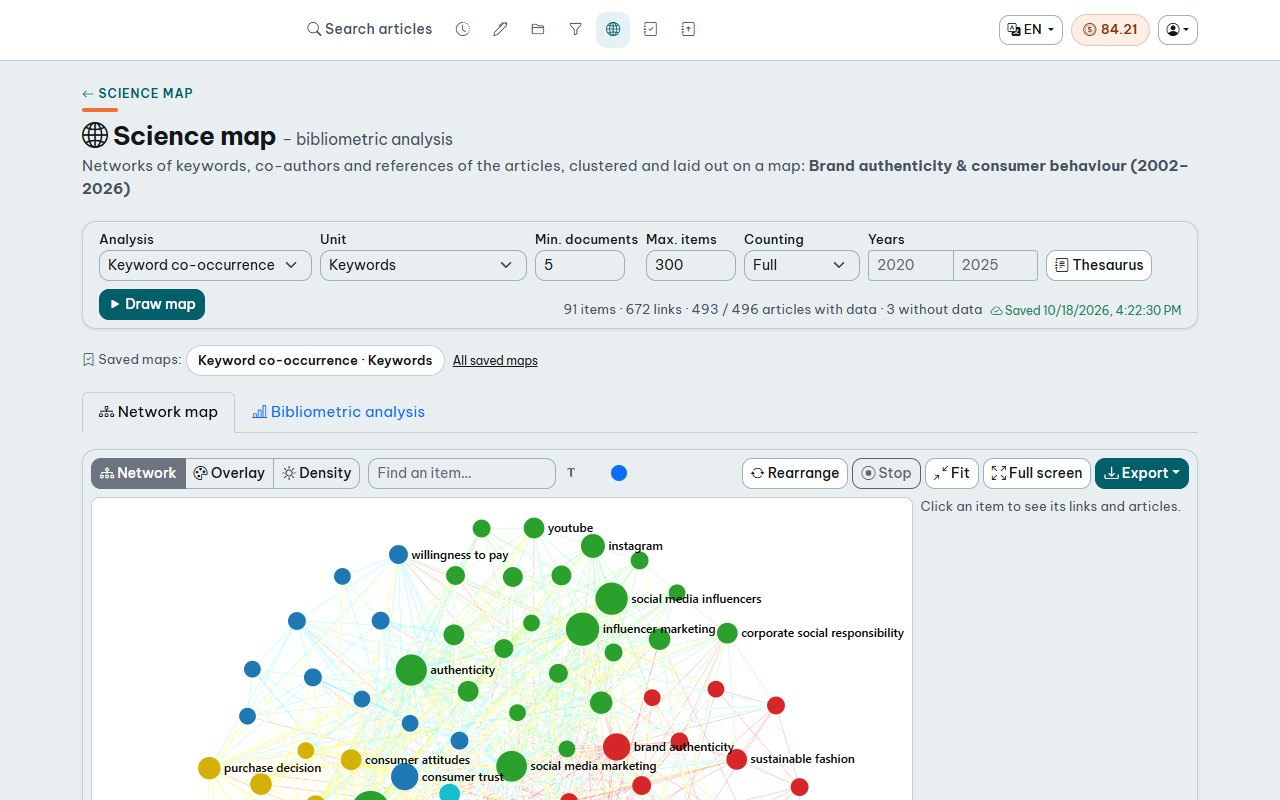
A bibliometric map: keyword, co-authorship, coupling and co-citation networks. Open it from a folder (Analyse › Science map), from the search results ( Science map button: the filtered results, up to 5,000 articles), or from in the top bar: upload an export from Web of Science (plain text / tab-delimited), Scopus (CSV), RIS or BibTeX – the map uses the DOIs of the records.
- Analyses: co-occurrence of keywords or of terms mined from titles and abstracts; co-authorship by author, institution or country; bibliographic coupling of documents or journals (two items are linked when they cite the same works); co-citation (two cited works are linked when the same article cites both – shows the theoretical and methodological foundations); direct citation between the articles or journals of the set.
- Terms: from title + abstract or title only; relevance 60% drops general terms that go with every topic. Thesaurus (button next to the years): one line per entry,
label ; replacementto merge orlabel ;to remove; thesaurus files (label and replacement separated by a tab) can be loaded; kept in your browser. - Years: limit the articles to a period to see the topics of each stage.
- Thresholds: minimum documents per item (for documents: minimum citations) and maximum number of items; only the most strongly linked items are kept. Fractional counting shares an article's weight among its links.
- Network: colour = cluster (items closely linked to each other), size = documents; only the 1,000 strongest lines are drawn. Overlay: colour by average publication year or citations – shows emerging topics. Density: a heat map – yellow/orange areas gather many large items.
- Click an item for its figures, strongest links and articles. Rearrange lets the map move to a new layout, Stop freezes it.
- Name clusters with AI (below the map, uses credits): the AI reads the main items of each cluster and gives a name and a one-sentence description; names appear on the map and in the exports. Check them against the items.
- Export: PNG/SVG image, items and clusters (CSV), and a network map (JSON) – a standard format that network-visualisation tools can open.
- Articles are matched by DOI; articles without a DOI or without data are left out and the map says how many.
- Saved automatically: each set keeps one map per analysis (keywords, co-authorship, co-citation …); reopening shows the same settings, layout, clusters and AI names, without recomputing and without credits. The Saved maps buttons above the map switch between analyses; the list of all saved maps (folders, search results, uploaded files) is on the first page of the Science map, where each can be opened or deleted.
- Word report (Export menu): settings, the map image, clusters and strongest items, the method description and references – ready for the method section of a paper. Methods & calculations under the map explains every step.
- Sample files for each format can be downloaded on the upload page. Administrators can also open the map for a whole institutional publication list.
- The Bibliometric analysis tab next to the map: see section 13.
13. Bibliometric analysis
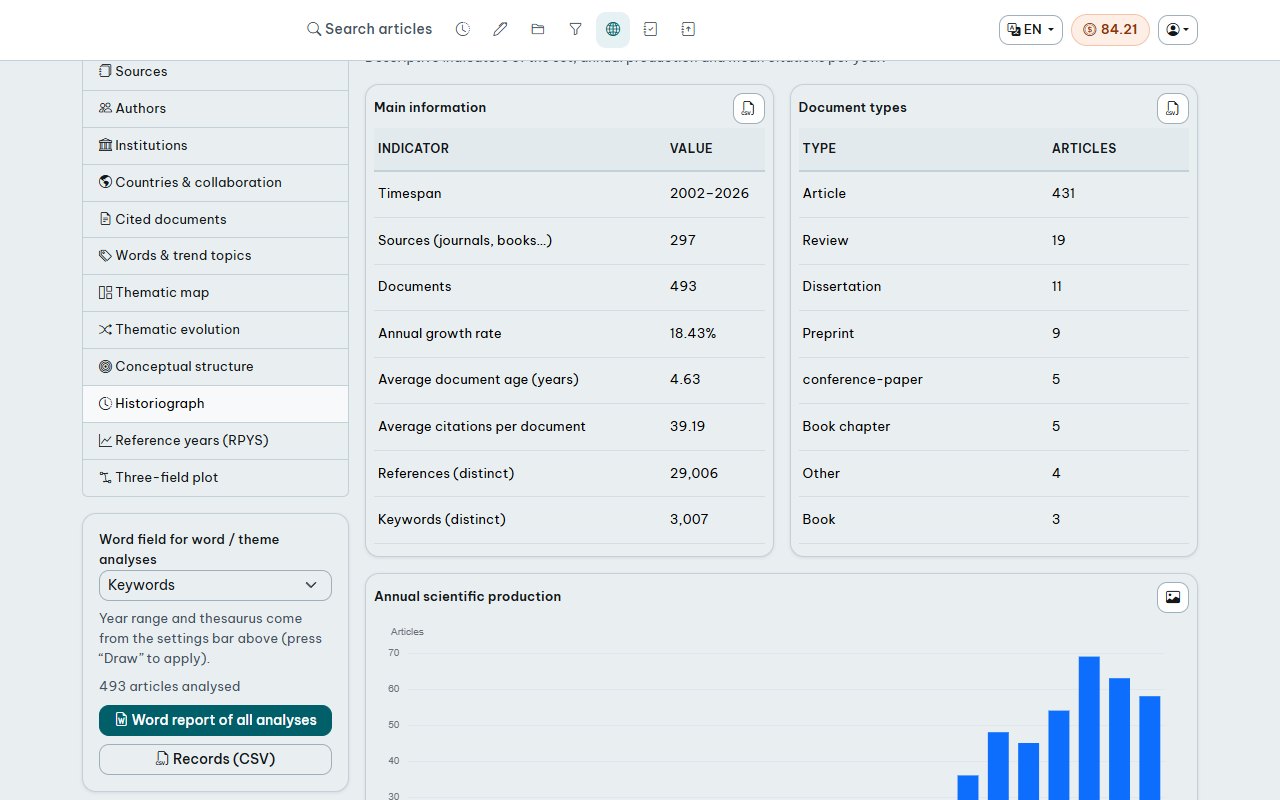
In the Science map, the Bibliometric analysis tab computes standard bibliometric indicators and charts for the same set of articles, with the year range and thesaurus of the settings bar above (press Draw map to apply changes). Choose an analysis on the left; every chart downloads as PNG and every table as CSV .
| Analysis | Shows |
|---|---|
| Main information | Timespan, sources, documents, annual growth rate, average age, average citations, authors, single-authored documents, co-authors per document, international co-authorship, document types; production and mean citations per year. |
| Sources | Most productive sources; h, g, m indices of sources; Bradford’s law (zone 1 = core sources with about a third of the articles); cumulative production of the main sources. |
| Authors | Most productive authors, h/g/m indices, production over time (size = articles, colour = citations per year), Lotka’s law (distribution of articles per author against theory). |
| Institutions | Institutions with the most articles. |
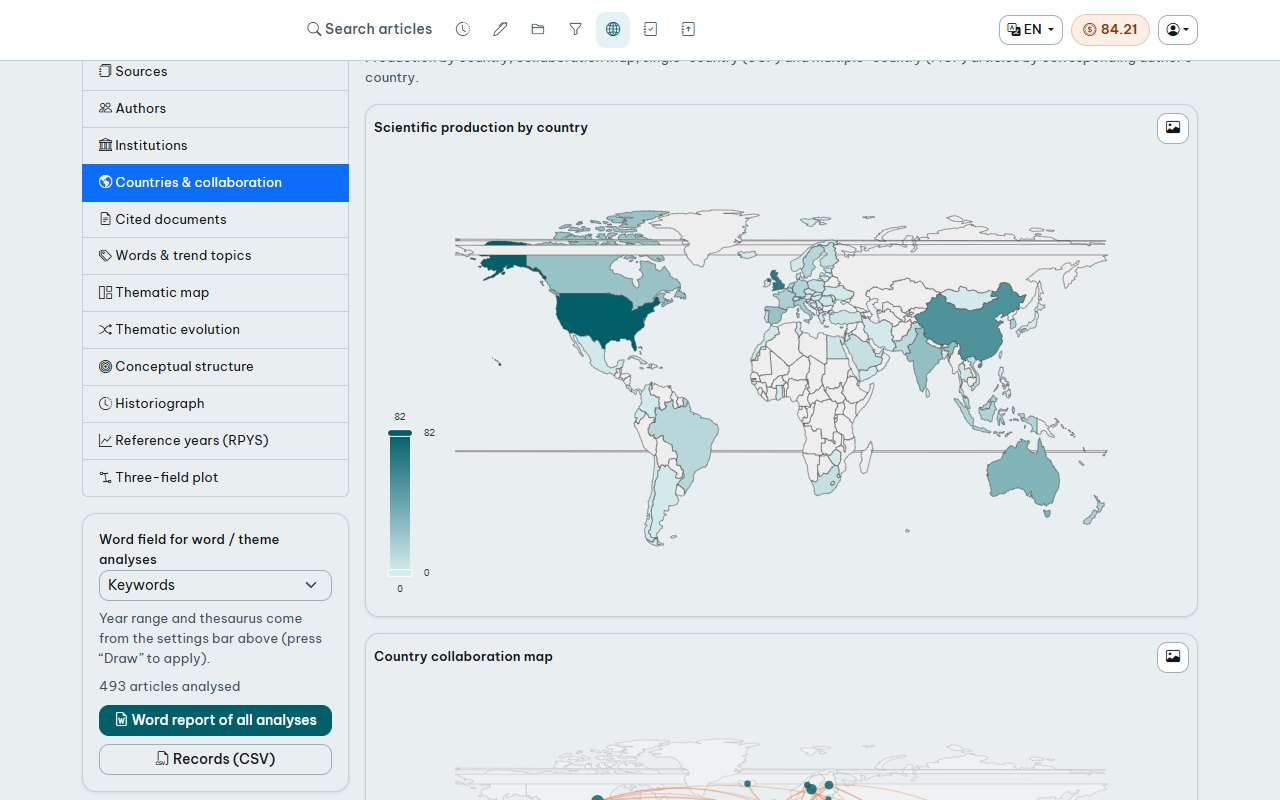
| Countries & collaboration | World production map, collaboration map (lines between countries with joint articles), single-country (SCP) and multiple-country (MCP) articles by corresponding author’s country, most frequent country pairs. |
| Cited documents | Most globally cited articles (TC, TC per year, TC normalised by year) and most locally cited (LCS); references most cited by the set. |
| Words & trend topics | Most frequent words, treemap, word dynamics, trend topics (Q1 – median – Q3 year of each word). |
| Thematic map | Themes (word clusters) placed by centrality and density – see how to read it below. |
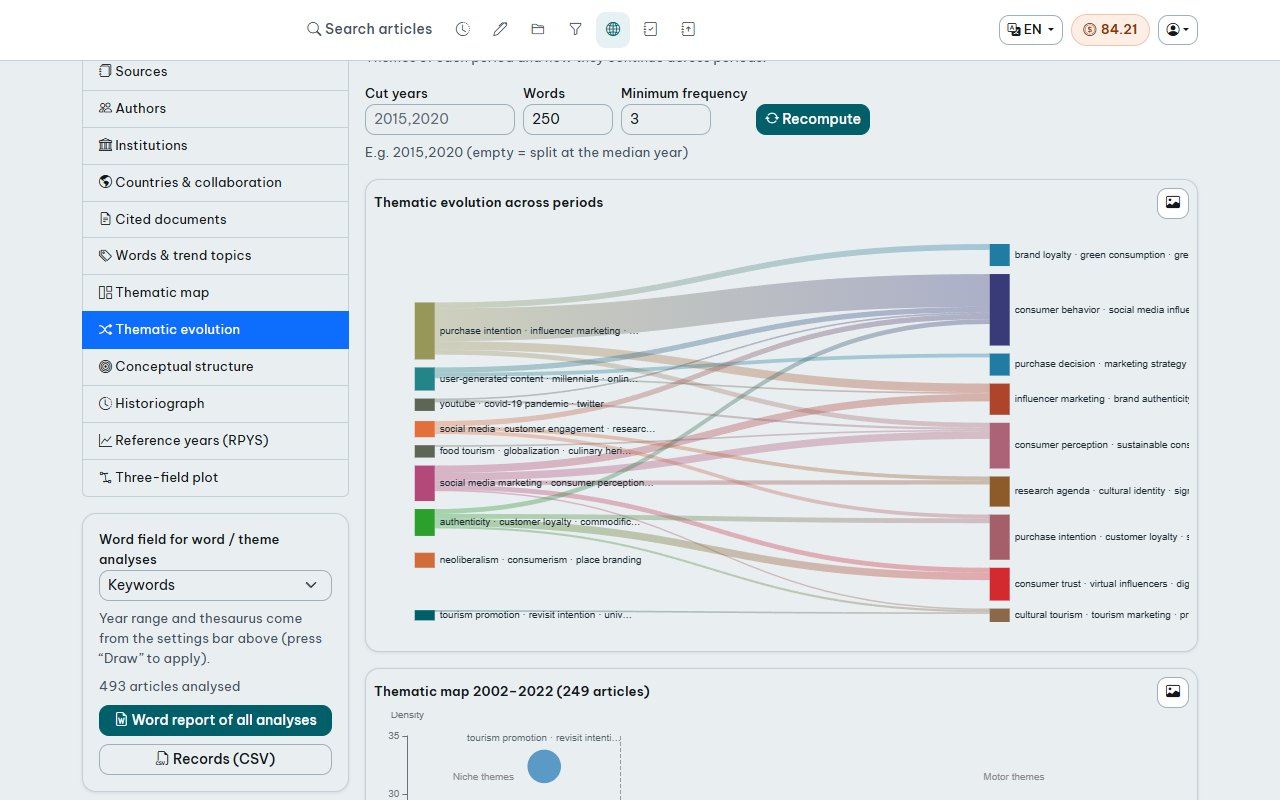
| Thematic evolution | Themes of each period (enter cut years, e.g. 2015,2020) and how they continue (flow diagram). |
| Conceptual structure | Correspondence analysis: words often used together lie close; groups by k-means (number of groups chosen automatically, or set). |
| Historiograph | Direct citations between the set’s most locally cited articles, by year – the development line of the field. |
| RPYS | Cited references by their publication year; positive peaks are the years of the field’s historical roots. The first time, the year data must be read (the number of requests is shown first; uses credits), then it is kept. |
| Three-field plot | Relations between three chosen fields (source, author, word, country, institution, year); flow width = joint articles. |
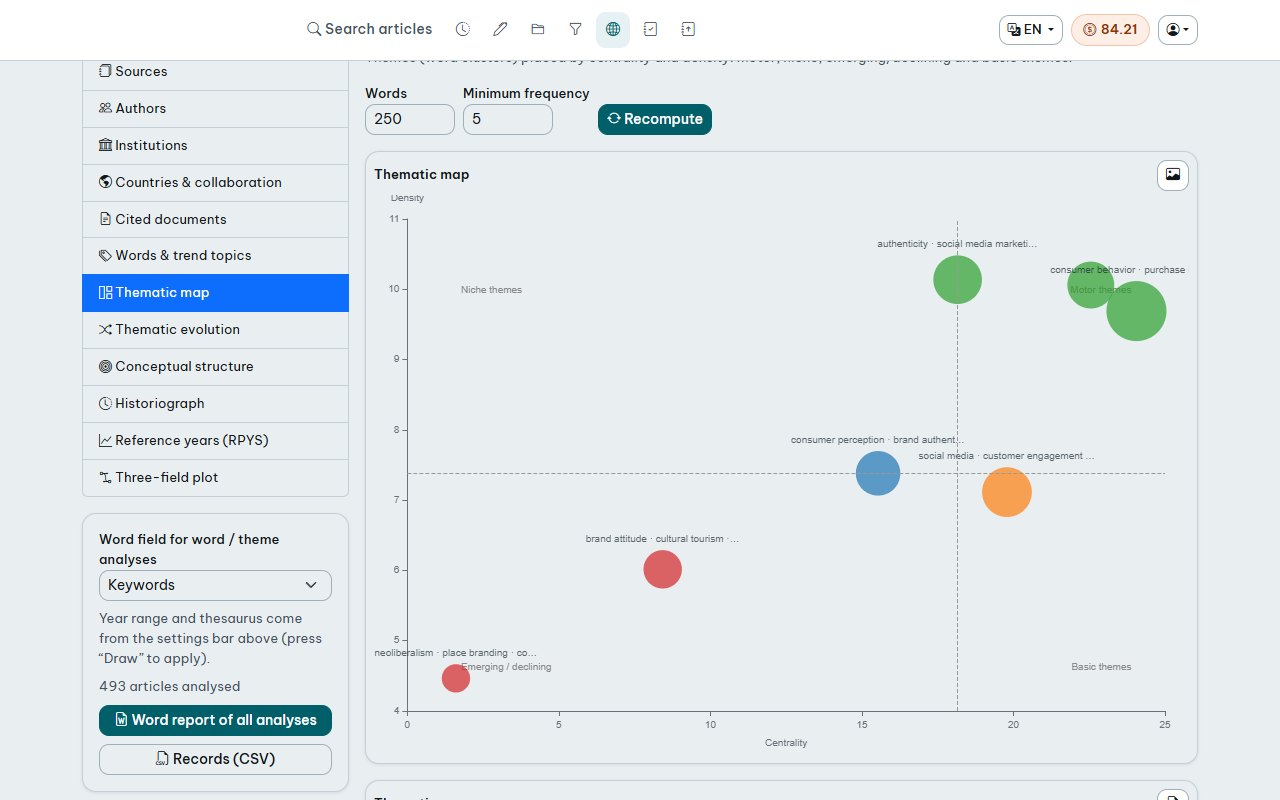
Reading the thematic map: the axes cross at the median of the themes; bubble size is the occurrences of the theme’s words.
- Upper right – motor themes: well developed and strongly linked to other themes; the core of the field.
- Upper left – niche themes: well developed but weakly linked outside; specialised.
- Lower left – emerging or declining: weak and peripheral; check the thematic evolution to see whether they rise or fade.
- Lower right – basic themes: widely linked but not developed in depth; general, foundational concepts.
- Word field (left column): the word and theme analyses use keywords or terms in titles and abstracts.
- Each analysis has its own settings (words, minimum frequency, groups …); change them and press Recompute. Results are stored and reopen instantly.
- Word report of all analyses: every chart and table of the 13 analyses, the methods with formulas and the references. RPYS is included only when its year data has been read.
- Records (CSV): the articles in the common export layout of bibliographic databases, readable by other bibliometric software.
- The analyses use no credits (except the first RPYS). Formulas and references of every indicator are under Methods & calculations below the analyses.
14. Systematic review (PRISMA)
A screening workflow for systematic reviews following PRISMA 2020. Open Systematic review (the icon in the top bar), or from a folder: Analyse › Systematic review (PRISMA) to create a review from the folder or add the folder to an existing review.
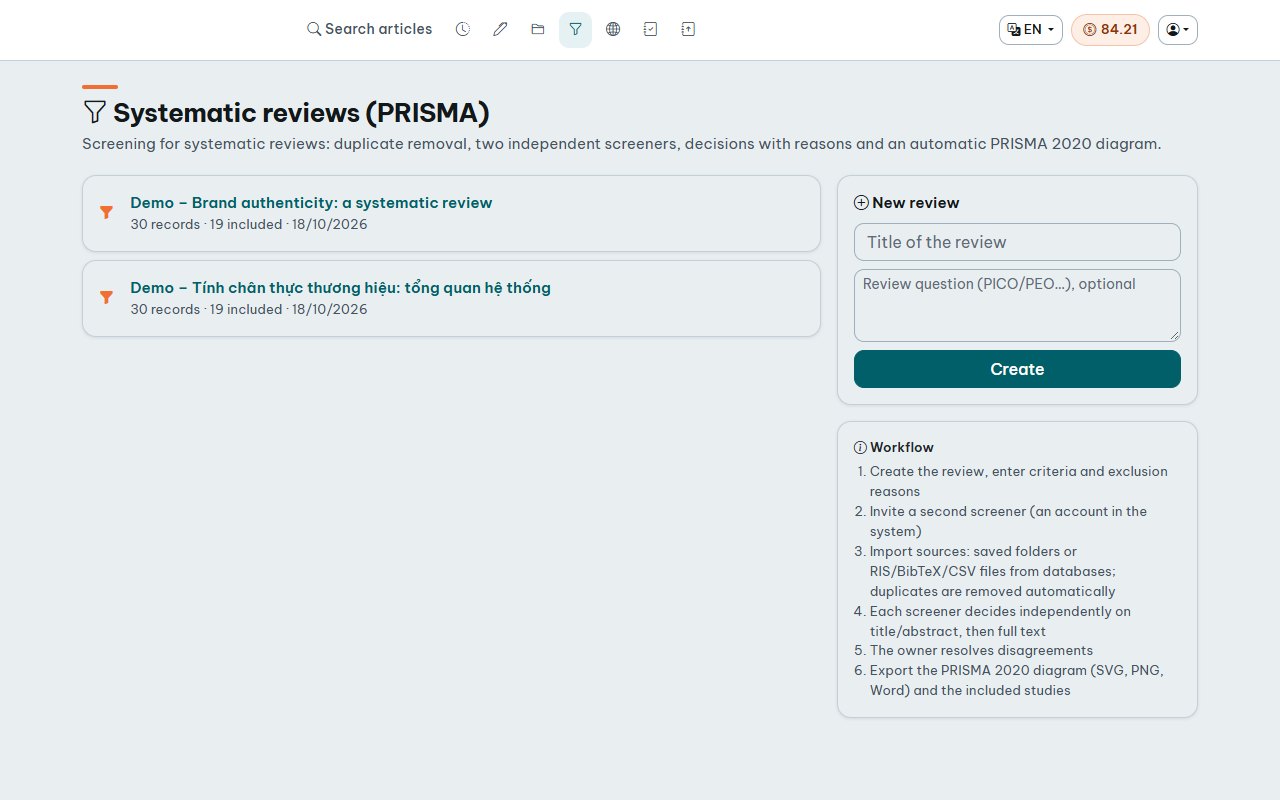
- Create a review with a title and the review question (PICO/PEO …).
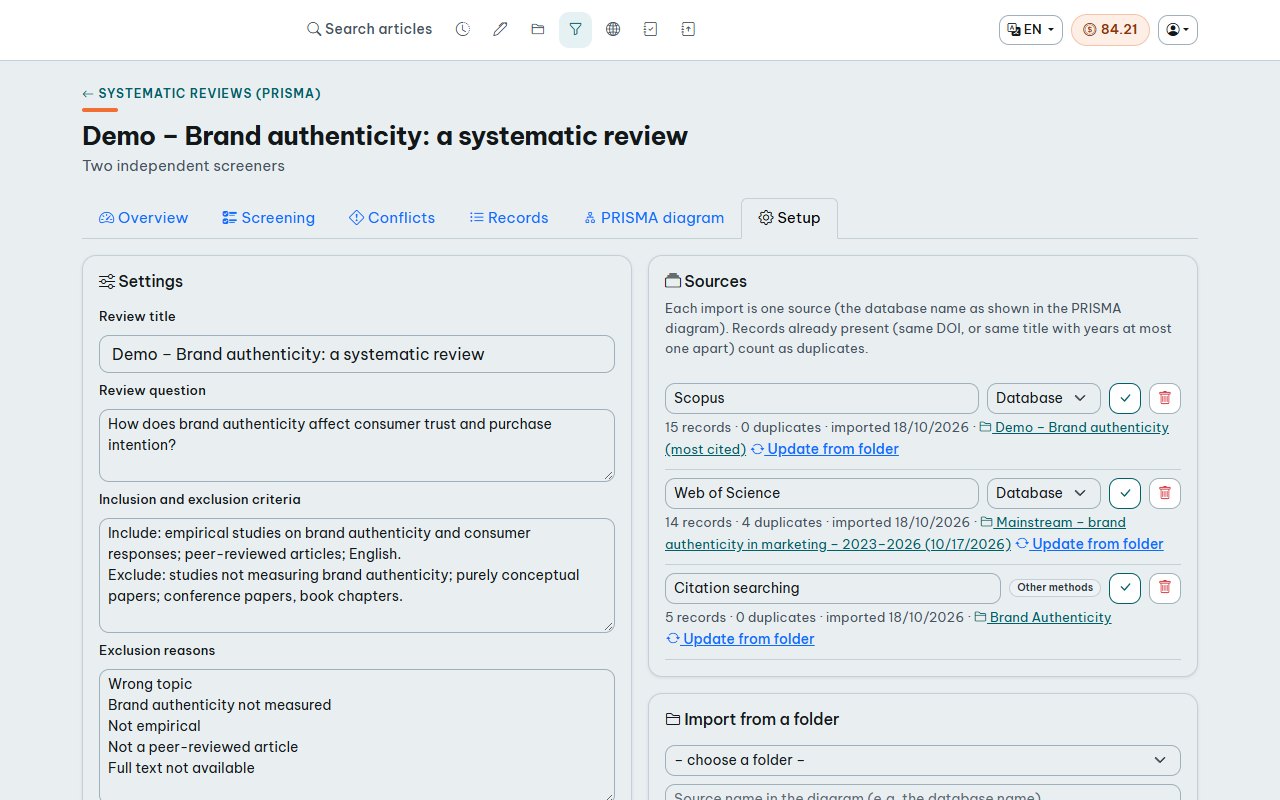
- Setup (tab Setup): inclusion and exclusion criteria (shown to screeners), the list of exclusion reasons (one per line), two independent screeners (recommended) or one, and add screeners by the e-mail of their account.
- Import sources: from a folder, or a RIS / BibTeX / CSV file exported from Scopus, Web of Science, PubMed, Zotero …. Name the source as it should appear in the diagram (e.g. Scopus) and choose its type: database, register or other methods (websites, citation searching – as in PRISMA, these go straight to retrieval). A source taken from a folder stays linked: Update from folder adds the folder’s new papers.
- Automatic duplicate removal: records with the same DOI, or the same title with years at most one apart, count as duplicates and are not screened. In the Records tab (filter Duplicates) press Not a duplicate, or mark a record as a duplicate of record #.
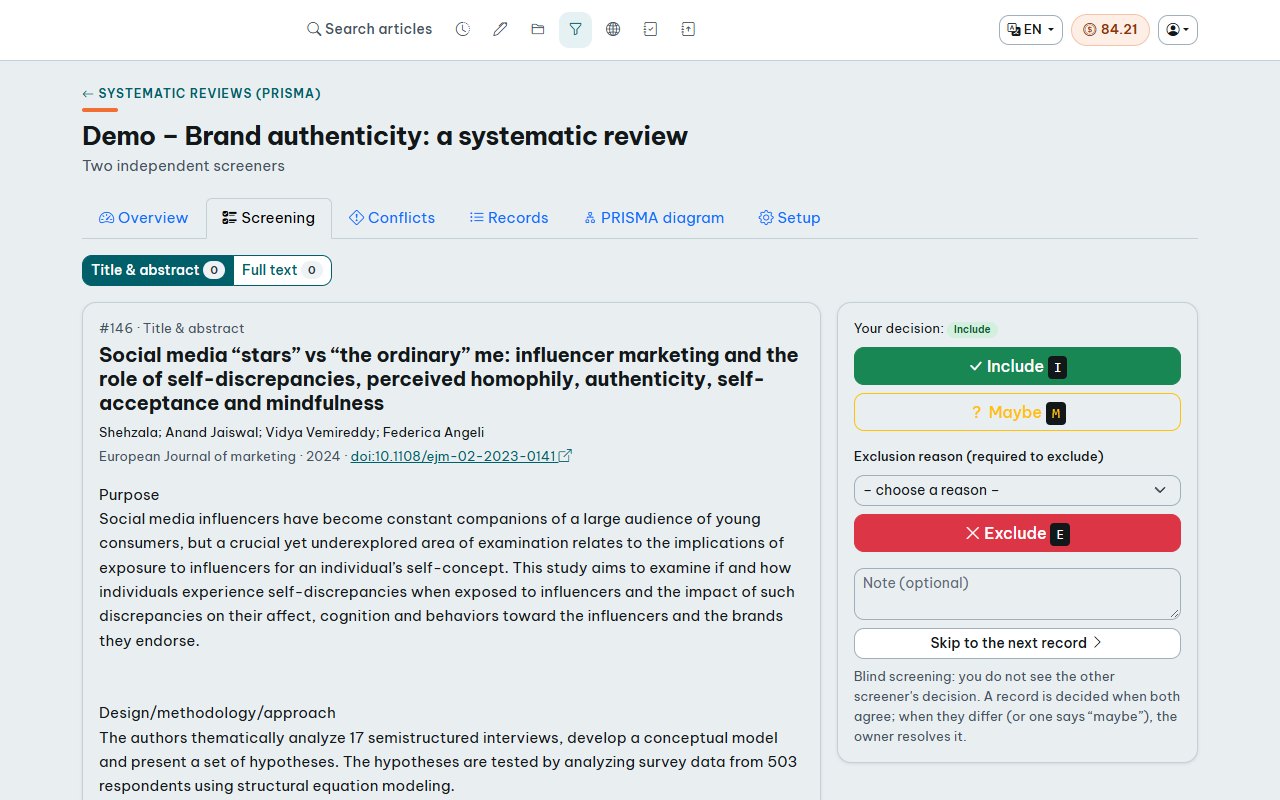
- Screen on title & abstract, then on full text for the included records: Include, Maybe or Exclude (a reason is required), with a note if needed; shortcuts I / M / E. Screening is blind: screeners do not see each other’s decisions.
- Conflicts (owner): a record is decided automatically when both screeners agree; when they differ or one says “maybe”, it goes to the Conflicts tab for the owner’s final decision. The full-text stage also has Full text not retrieved.
- The PRISMA 2020 diagram (tab PRISMA diagram) updates with every decision; download it as Word (diagram, table of steps, sources, exclusion reasons, agreement and the included studies in APA), PNG or SVG.
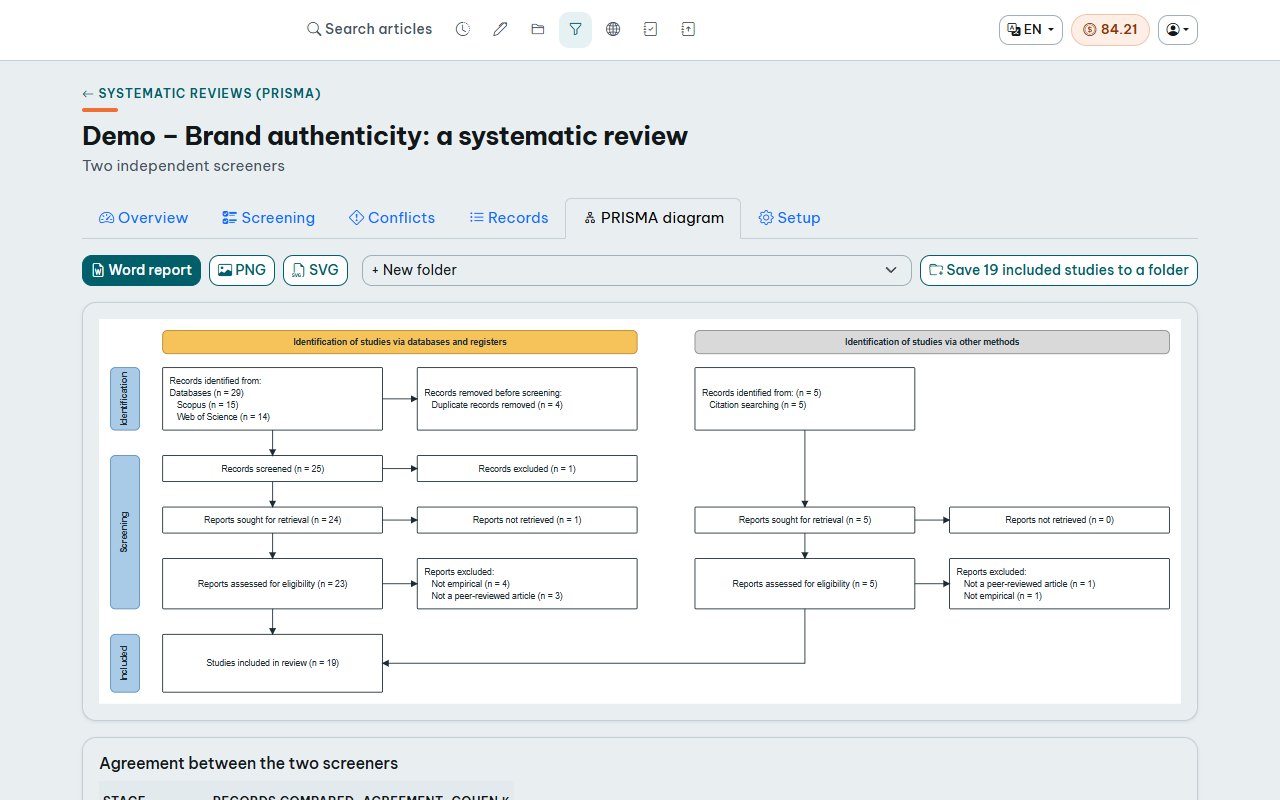
- Agreement: with two screeners, the diagram page shows the records compared, the share of agreement and Cohen’s kappa (above 0.6: good; above 0.8: very good) – often required when reporting a systematic review.
- Records: filter by state (waiting, excluded, included, duplicates …), search by title or DOI, export a CSV of all records with their decisions, or RIS / BibTeX of the included studies.
- Save the included studies to a folder (Overview or PRISMA diagram tab) to summarise them, build a literature matrix or draw a science map of the included studies.
- The owner manages setup, sources, screeners and conflicts; screeners screen and see the results. Systematic reviews use no credits (except the Add abstract … option when importing a file).
15. Journal finder
Open Journal finder in the top bar to find where to submit a manuscript.
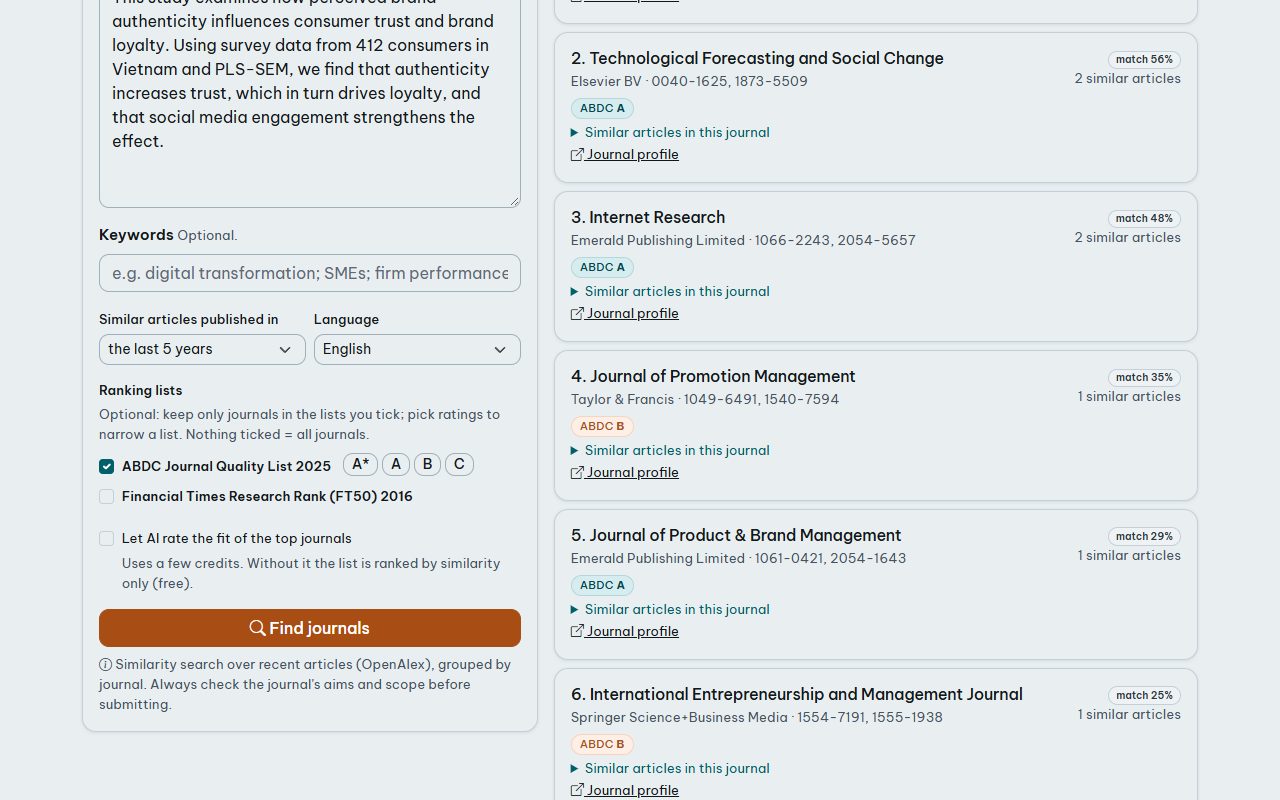
- Enter the title and the abstract (keywords are optional) and choose the period of similar articles (last 3, 5 or 10 years).
- Optionally keep only journals of chosen ranking lists and ratings – the lists come from the system, so new lists added by the administrator appear here automatically.
- Optionally let AI rate the fit of the top journals (★ 1–5 with a reason and overall advice; uses a few credits). Without it the list is ranked by similarity and ranking only, free of charge.
- Each journal shows its publisher, ISSN, ranking badges, how many similar articles it published and examples of them. Journals on the exclusion list are left out and listed separately.
16. Reference check
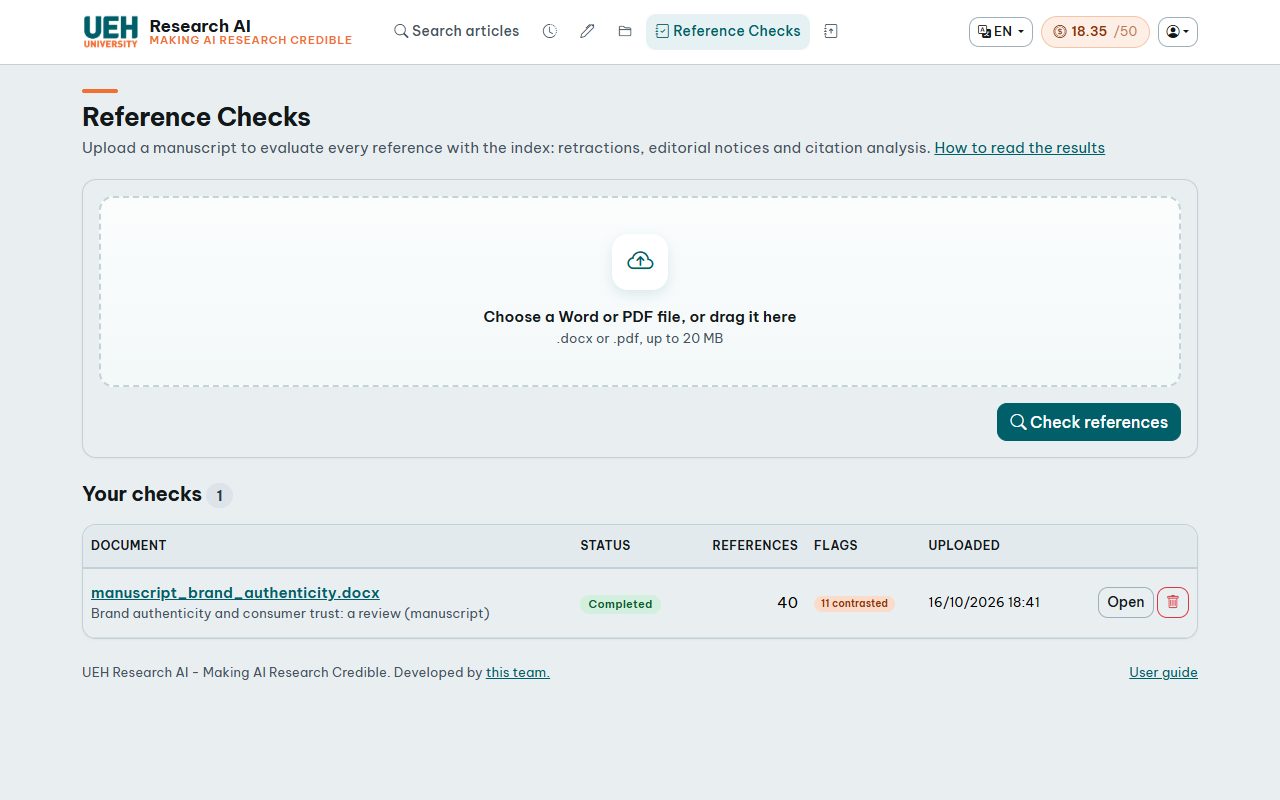
- Upload your manuscript in Reference Checks: a
.docxor text-based PDF (scanned PDFs cannot be read; save old.docfiles as.docx). - AcaGenie finds the reference list and splits it into references (numbered and author–date styles).
- Each work is identified step by step: a DOI written in your reference is first verified (does it exist, does it belong to this title?) and corrected when it points elsewhere; references without a DOI are looked up by title in several scholarly databases (accepted only when title, year and first author agree). Works that have no DOI at all – books, reports, some journals such as JMLR – are still recognised.
- The citation data, editorial notices and abstract of each work are collected, and the sentences of your manuscript that cite it are compared with it. The progress bar shows each step; you may close the page – the check continues on the server.
- For references cited in your text, an open-access full text is looked for (open-access copies, publisher pages, repositories). When one is found, each citing sentence is also compared with the best-matching passages of the full text, which the AI uses together with the abstract (badge Full text read; the passage is shown under the sentence).
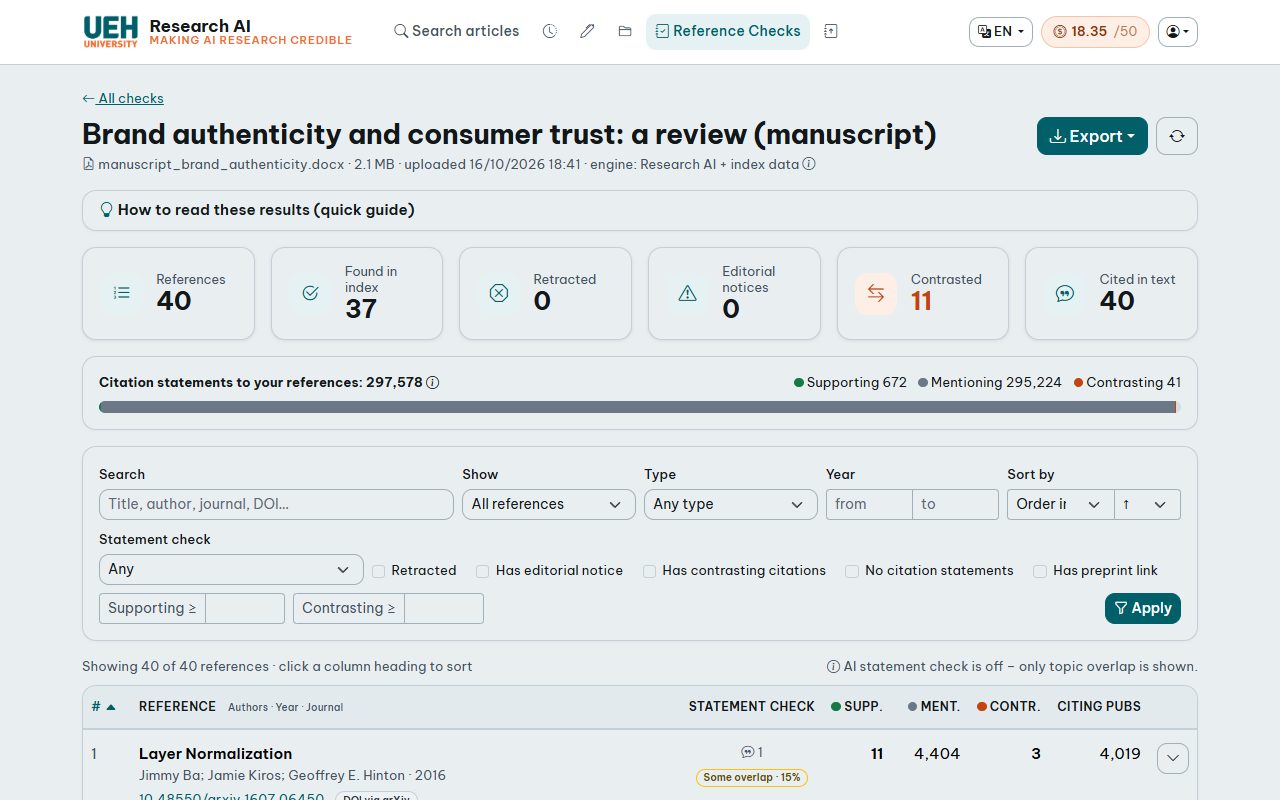
- Summary cards: references found, found in the index, retracted, with editorial notices, contrasted, cited in the text. The coloured bar adds up the citation statements of all your references.
- Reference table: one row per reference with ranking, institution list, exclusion warning and type labels; retracted works are red. Identified (no DOI) marks a work found without DOI (no citation statements). DOI corrected, DOI may be wrong and DOI does not exist flag problems with the DOIs written in your manuscript – a non-existent DOI can mean a mistyped or a fabricated reference. No DOI identified and Not in index need a manual check; DOI via … shows how the DOI was found. Open for details.
- Filter, sort by clicking a column heading, and export the references shown to Excel, CSV, JSON or RIS.
17. Citations & format of a manuscript
On the result page of a check, press Citations & format to match the in-text citations against the reference list and check the format.
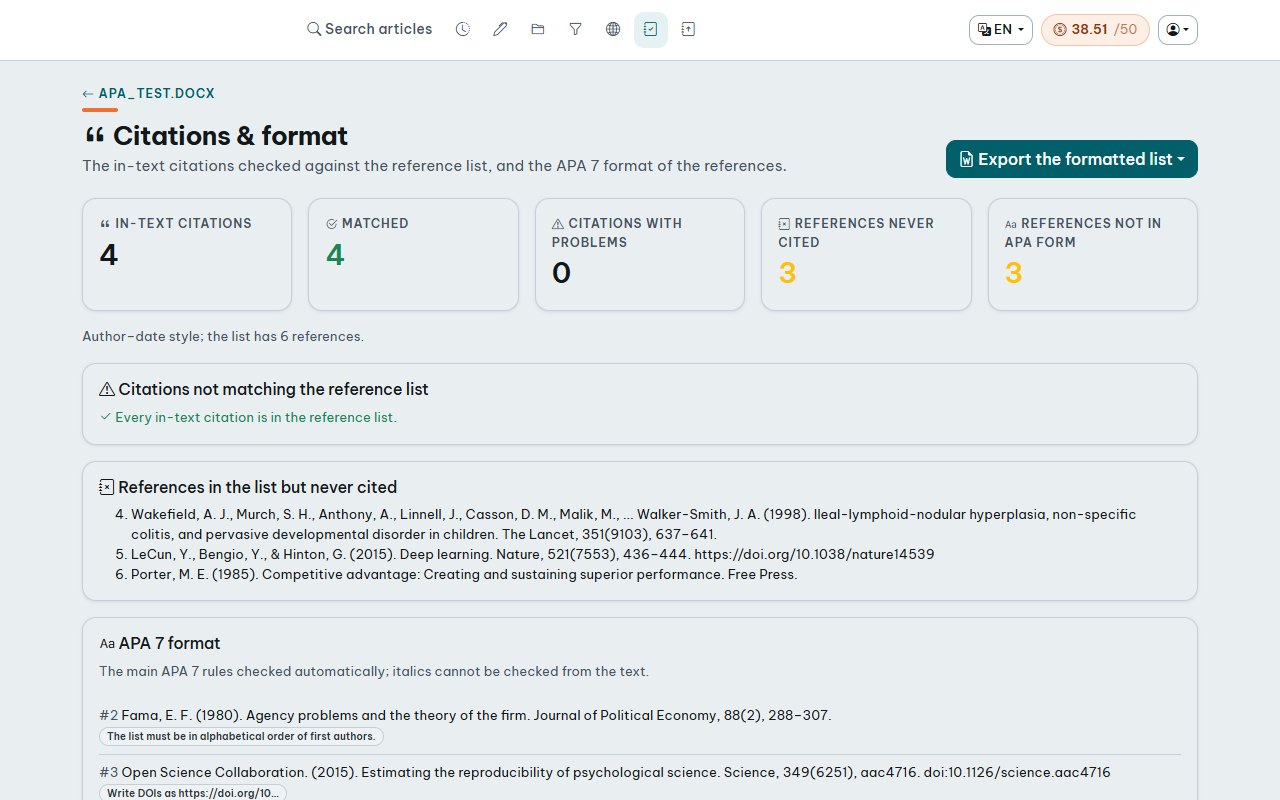
- Citations not matching the reference list: cited in the text but missing from the list, with a wrong year or a misspelt author, with the closest list entry and the sentence containing the citation. Author–date style (parenthetical and narrative, organisations as authors) and numbered style are supported.
- References never cited: in the list but not in the text.
- APA 7 format (author–date style): year in brackets, & before the last author, no “et al.” in the list, initials, DOI as
https://doi.org/…, page ranges with a dash and alphabetical order. - Export the normalised list to Word in APA 7, Harvard or Vancouver: built from the verified data of each reference (APA and Harvard alphabetical, Vancouver in list order); references that could not be verified are kept as written and marked *.
18. Citation statements explained
The sentence(s) around each citation in a citing paper – the citation statement – are classified by a machine-learning model:
Supporting
The citing paper provides evidence that agrees with or confirms the work.
“Our results are consistent with Smith et al. (2019)…”
Mentioning
Cited as background, method or definition, without evidence for or against. Usually 90%+ of citations.
“Agency theory (Jensen & Meckling, 1976) suggests…”
Contrasting
The citing paper reports evidence that disagrees with or differs from the work.
“In contrast to Smith et al. (2019), we find no effect…”
Citing publications is the number of distinct papers citing the work (the usual citation count). It can be larger than the number of statements because the full text of every citing paper is not available.
19. Statement check & appendix
Citing a real paper is not enough – it must say what you claim. For every reference, the sentences of your manuscript that cite it are compared with the cited paper's abstract:
- Topic overlap (always): High Some Low – shared vocabulary between your sentence and the abstract. Low overlap is normal for citations of methods, software or definitions.
- AI assessment (when enabled): Supported Partially supported Cannot verify Not supported Contradicted, with a short explanation.
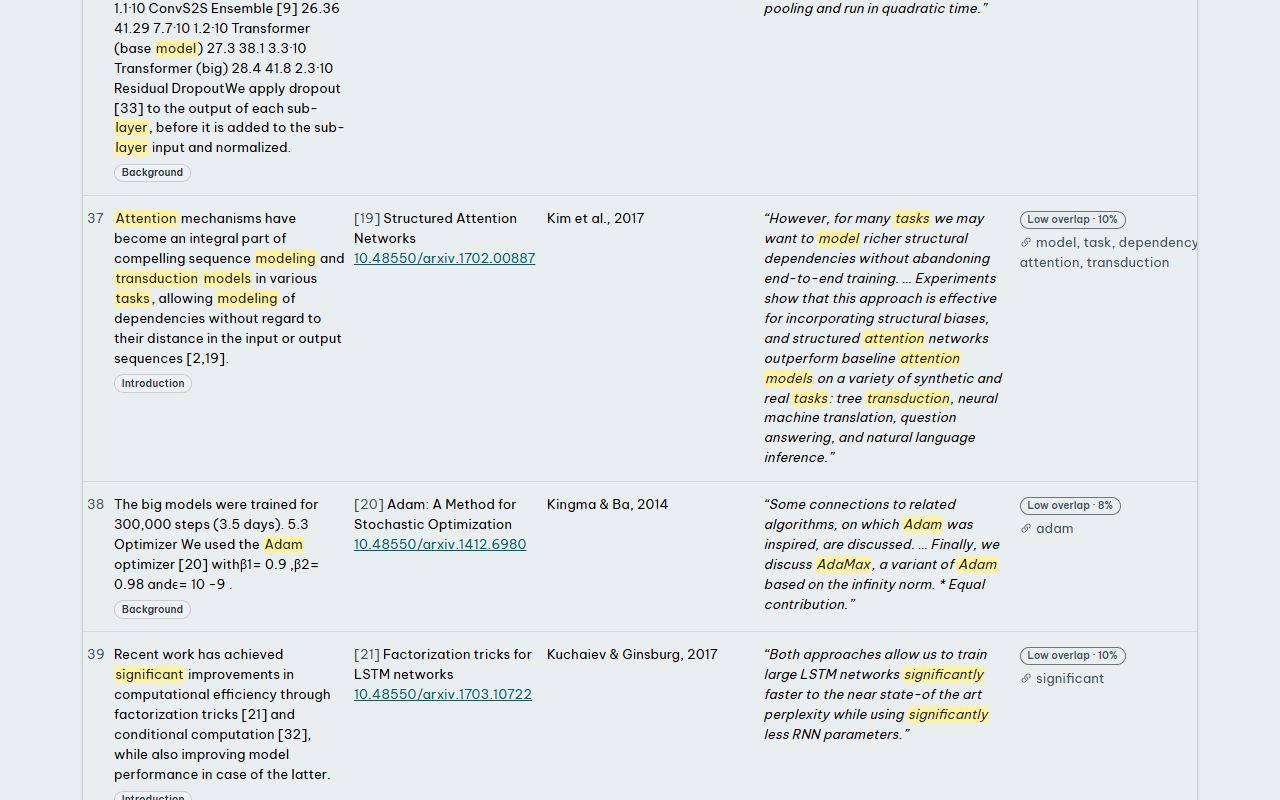
The appendix at the bottom of the result page lists every citing statement of your manuscript with the cited work, the author in APA style, the best-matching passage of the abstract (shared words highlighted) and the relevance measures. Download Word exports it (landscape) to keep with your manuscript or send to co-authors.
20. Retractions & editorial notices
- Retracted
- Withdrawn by the publisher (serious errors, fabricated data, plagiarism, ethics). Remove or replace it; if you must cite it, say that it was retracted and cite the notice.
- Withdrawn
- Removed by the authors or publisher. Treat like a retraction.
- Expression of concern
- The editors have doubts (e.g. an investigation). Use with caution and mention it if you rely on the work.
- Correction / Erratum
- An error was corrected; check that it does not affect the part you cite.
21. Credits & quota
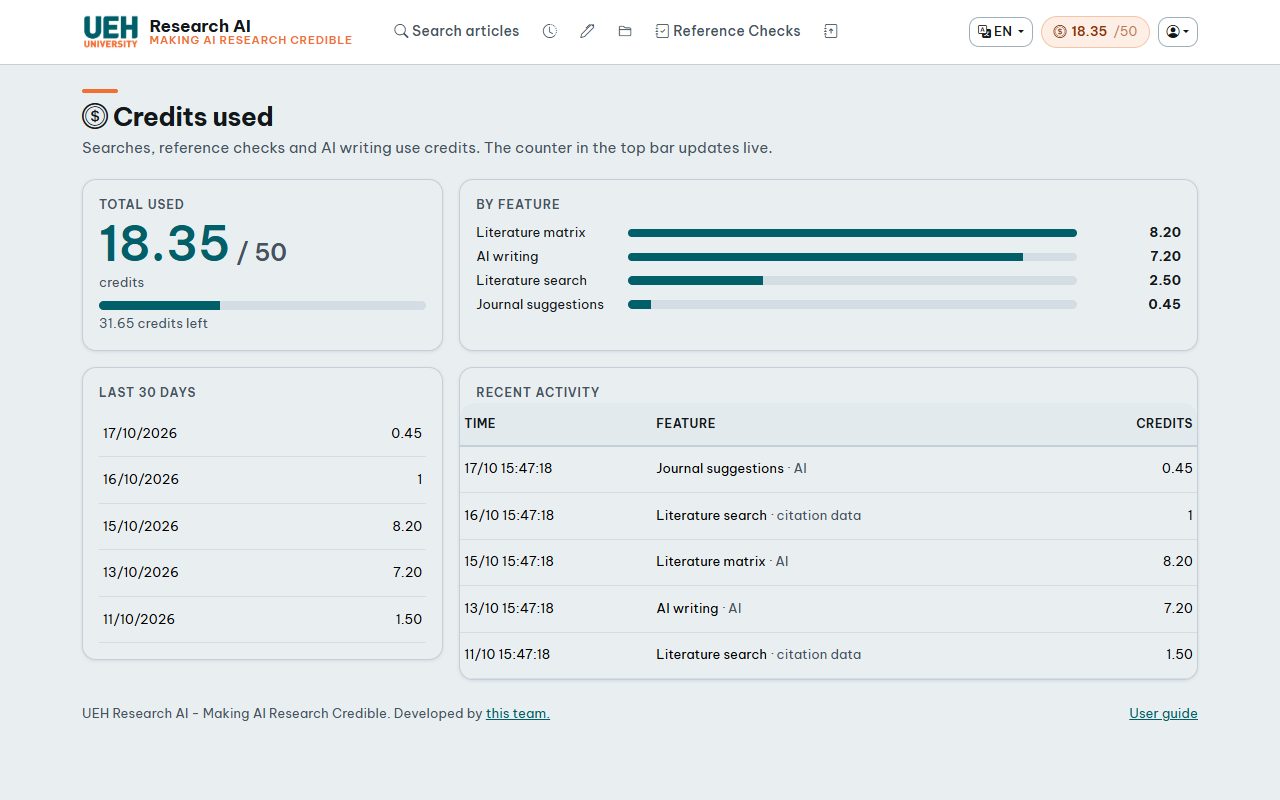
- New searches, reference checks, AI writing, matrices, AI journal advice, AI cluster names, the first data read of a citation map / science map (very little) and the year data for RPYS use credits. The counter 12.30/50 in the top bar updates live; click it for the details by feature and by day.
- Reopening stored searches, saved texts, matrices and maps, journal suggestions without AI, systematic reviews, the citations & format check and the bibliometric analyses (except the first RPYS) are free.
- Each account has a credit quota (the number after the slash). When it is used up, paid features pause until an administrator raises it; everything you saved stays available.
22. Your account
- Change password in the account menu (you need the current password; at least 8 characters).
- Forgot your password? on the sign-in page sends a reset link (valid 1 hour).
- The language (English / Tiếng Việt) is remembered in your browser.
- If the administrator limits registration to certain e-mail domains, only addresses in those domains (and their subdomains) can register; the registration page lists them.
- If your account was suspended, the sign-in page shows the reason – contact the administrator.
23. Limitations & good practice
- AI writing, the matrix and quote checks use abstracts, not full texts. Verify important claims in the full paper before citing.
- Citation classification and AI assessments come from models and are not perfect.
- Reference extraction is automatic; unusual layouts (two columns, footnotes, tables) may split or merge references. Word files usually work best. Matches without a DOI are a best guess.
- Coverage varies by field; books, Vietnamese-language and very recent papers often have little data.
- The science map and bibliometric analyses use only articles with a DOI; author, institution and country names come from the bibliographic database and may be missing or written differently – merge them with the thesaurus. Sets below about 50 articles give unstable results.
- Use the AI texts as a draft: rewrite them in your own words and follow your institution's rules on AI use.